AIA Stock Technicals Today: Drops 0.72%, Testing Key Resistance
On Juli 20, 2026: price 75.55 HKD, trend sideways, RSI 52.7, support 70.80, resistance 76.20. technical analysis of aia stock. AIA Stock Technicals — full…

AIA Group's latest session told two stories at once. The stock slipped 0.72% to 75.55 HKD on 17 July 2026, according to exchange data via Yahoo Finance — yet that modest dip capped a five-day rally of +3.99% that has carried Hong Kong's largest insurer to the very top of its recent trading range. Price now sits at 88% of its 20-day range, pressing directly against resistance, with volatility compressed to levels that historically precede decisive moves.
Trend & Price Action
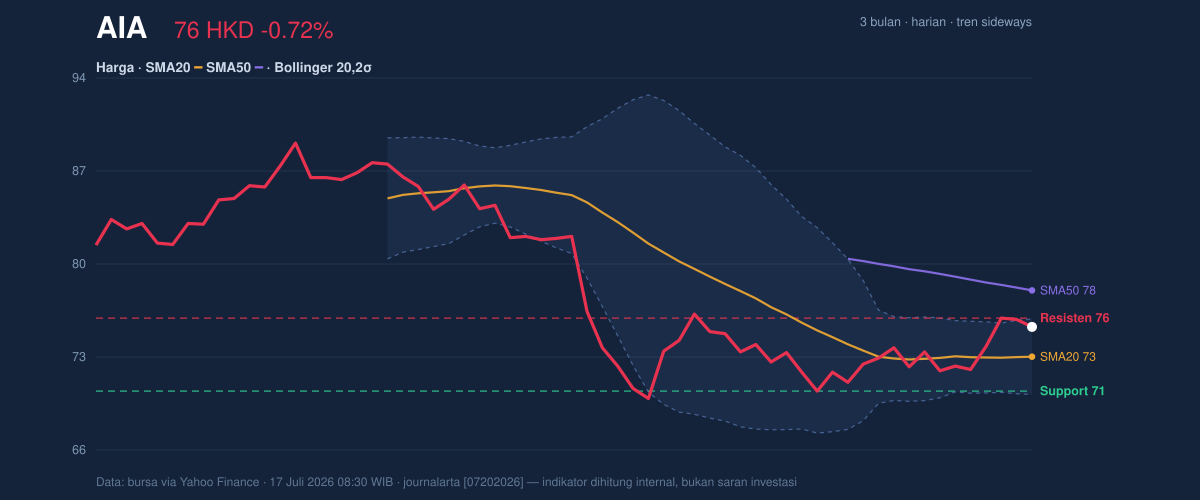
The recovery is real, but incomplete. AIA trades above its 20-day moving average at 73.34, confirming the short-term bounce has repaired immediate damage. However, the stock remains below the 50-day average at 78.25, and no golden cross or fresh MA-crossover has formed. The 20-day average itself is essentially flat, sloping just -0.05% over five days — the mathematical signature of a sideways market, not a new uptrend.
Within the three-month picture, the stock has climbed well clear of the 69.05 low but remains far below the 89.95 high, meaning the broader structure is still one of repair rather than advance. As shown in the chart, price is now testing a double barrier: the upper Bollinger band at 76.13 and the 20-day resistance at 76.20, with the Bollinger %B reading of 90% confirming the stock is hugging the top of its statistical envelope.
Oscillators & Momentum
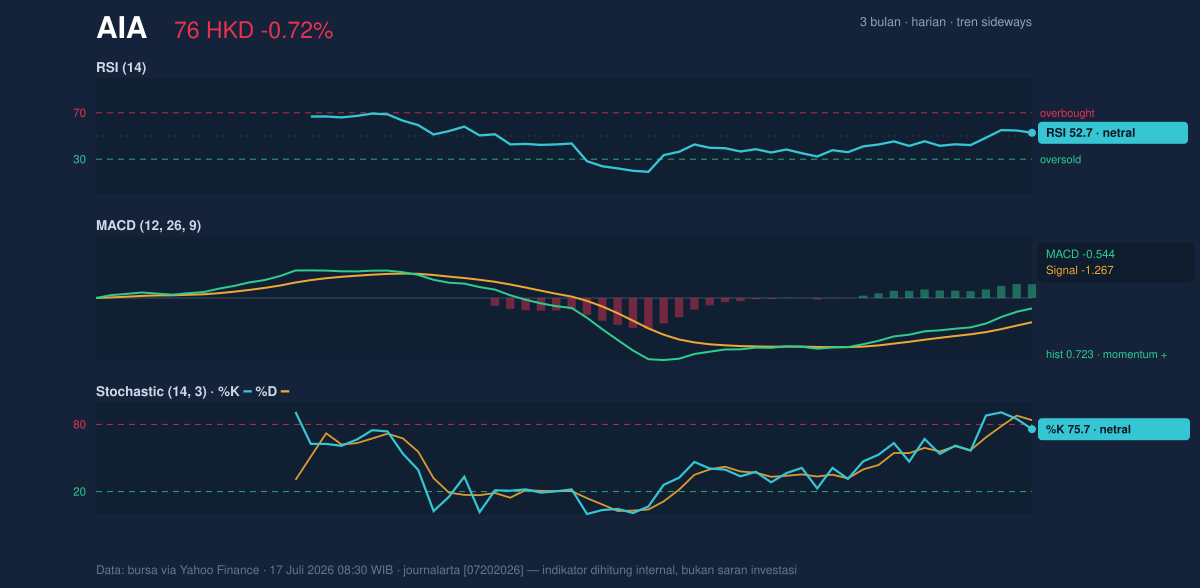
Momentum indicators, displayed in the chart below, sketch a market in recovery mode rather than confirmed strength. The RSI(14) at 52.7 sits squarely in neutral territory — importantly, the recent rally has not pushed the stock into overbought territory, leaving headroom if buyers do commit.
The MACD tells a quietly constructive story. The MACD line at -0.544 has crossed above its signal line at -1.267, producing a positive histogram of +0.723 — momentum is improving. The caveat: both lines remain below zero, meaning this is a recovery within weakness, not yet a confirmed uptrend. The Stochastic offers the one cautionary note: %K at 75.7 has slipped below %D at 83.8, a minor bearish crossover suggesting the five-day burst is losing short-term steam precisely at resistance.
Volatility & Volume
This is where the setup becomes genuinely interesting. The Bollinger band width has narrowed to just 7.6% — a classic squeeze. Squeezes matter because volatility is cyclical: compressed bands store energy that typically releases in an expanded directional move. The ATR(14) of 2.05, roughly 2.7% of price, confirms moderate day-to-day swings — wide enough to matter, calm enough to manage.
Volume, however, refuses to confirm. The last session's 20.3 million shares represent only 0.7× the 20-day average of 28.2 million — rallies built on thin participation are fragile. The counterweight is On-Balance Volume, which is rising: cumulative buying pressure is quietly building even as headline volume stays subdued, a divergence that often resolves in favour of the patient side.
Key Levels & Scenarios
The architecture is clean. Above, resistance at 76.20 — reinforced by the upper band at 76.13 — is the level that decides everything; a confirmed break exposes the 50-day average at 78.25. Below, the first floor is the 20-day average and Bollinger midline at 73.34, followed by support at 70.80 and the lower band at 70.55, with the three-month low of 69.05 as the last defence.
If price closes above 76.20 with expanding volume, the squeeze resolves upward. If it fails here a third time and loses 73.34, the recovery narrative collapses back toward 70.55–70.80.
Technical Verdict: HOLD
HOLD (wait & see) — the setup is promising but unconfirmed. Three reasons stand out:
- The Bollinger squeeze at 7.6% width with %B at 90% places price at the breakout trigger, but volume at 0.7× average means conviction is absent.
- The positive MACD histogram (+0.723) and rising OBV show pressure building beneath the surface — reason to watch, not to chase.
- Price sits between the SMA20 (73.34) and SMA50 (78.25) with no MA-cross — the trend itself has not yet voted.
Verdict invalidated if price falls below 73.34, which would break the recovery structure and reopen 70.55.
- Entry Range: 73.30–73.60 on a pullback into the 20-day average, or on a confirmed close above 76.20
- Exit Target: 78.25, the 50-day moving average
- Stop Loss: below 70.55, the lower Bollinger band
For non-traders: the stock is coiled like a spring just beneath a ceiling it must clearly break — the only fact that matters next is a daily close above 76.20 HKD, or below 73.34.
Summary Data AIA
| Last price | 75.55 HKD |
| Change 1 day / 5 days / 1 month | -0.72% / 3.99% / 0.67% |
| Trend / MA-cross | sideways / none |
| SMA20 / SMA50 | 73.34 / 78.25 |
| RSI (14) / Stochastic %K | 52.7 / 75.7 |
| Bollinger %B / ATR | 90% / 2.05 |
| Support / Resistance 20 days | 70.80 / 76.20 |
| Data as of | 17 Juli 2026 08:30 WIB |


