TMUS Stock Analysis: Gains 2.82%, Testing Key Resistance
On September 3, 2026: price 187.30 USD, trend sideways, RSI 58.9, support 173.46, resistance 187.30. technical analysis of tmus stock. TMUS Stock Analysis —…
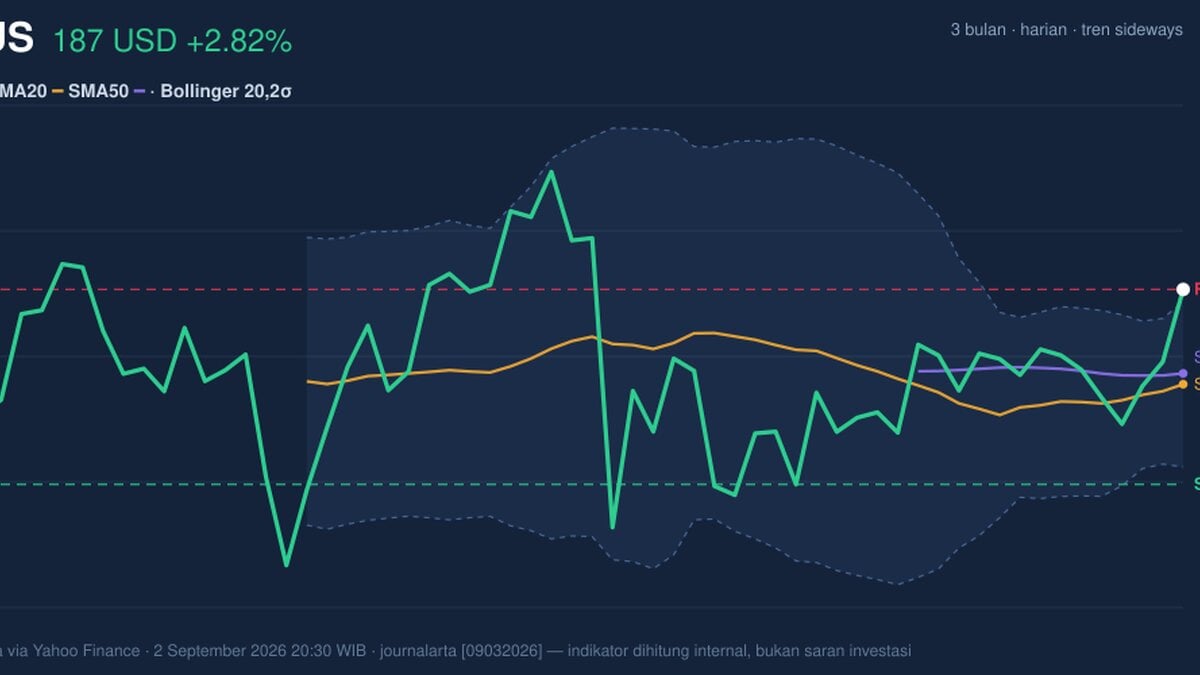
T-Mobile US is pressing against the top of its recent trading band, and that matters because a stock can look strong even when the next move is still being negotiated by momentum and volume. On NASDAQ, TMUS last traded at 187.30 USD, up 2.82% on the day and 5.69% over one month, according to exchange-linked market data via Yahoo Finance. The move leaves the shares at the upper edge of their 20-hour range, but the message from the chart is not simply “up”; it is that buyers have pushed price to a point where the market must now prove whether this is a genuine breakout or just a stretched rally.
Trend & Price Action
As shown in the chart, TMUS is still labeled sideways, even after the latest push higher, because the broader structure has not yet resolved into a clean directional trend. The stock sits above the SMA20 at 180.58 and above the SMA50 at 181.34, which tells readers that short-term price is trading above its recent average and has reclaimed some near-term control. Yet there is no new MA-cross, so this is not the sort of moving-average alignment that usually signals a full trend change. In plain language, the stock is above its baseline, but the baseline itself has not turned decisively upward.
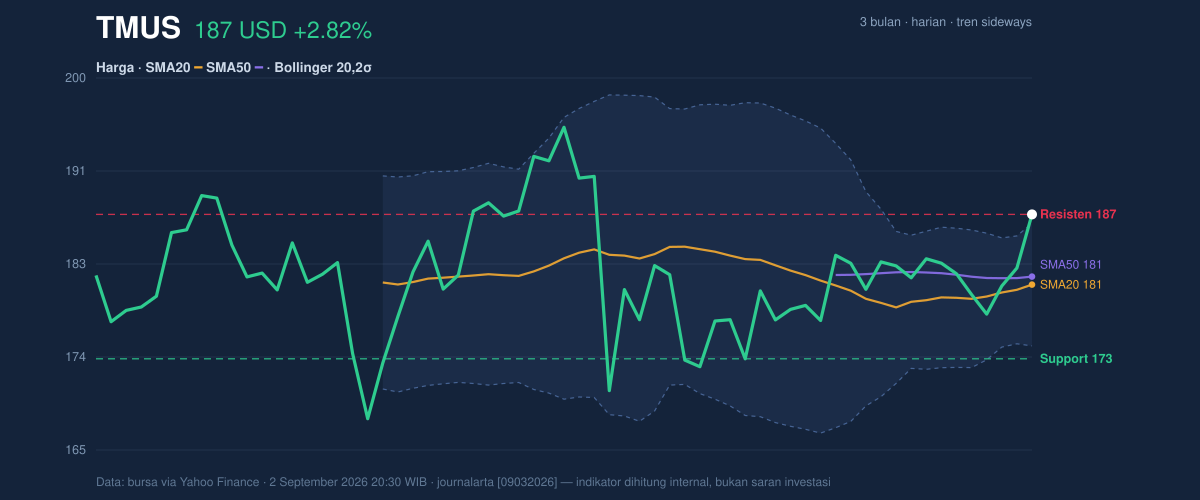
The recent advance also places TMUS at 100% of its 20-hour range, with support at 173.46 and resistance at 187.30. That positioning is important: when price reaches the top of a measured range, the market often pauses to see whether there is enough demand to absorb supply from traders taking profits. The broader three-month range, 198.86 to 165.66, shows that the stock is trading in the upper half of its recent history, but still below the prior peak. That means the current move has repaired weakness, without yet erasing the possibility of another round of consolidation.
Oscillators & Momentum
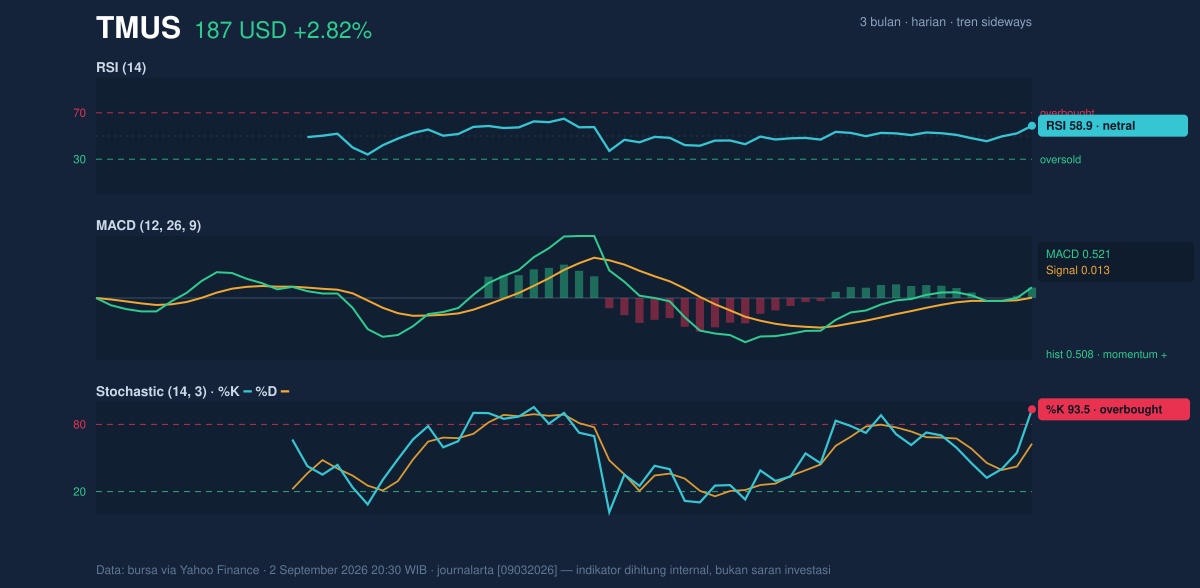
The momentum picture is mixed, and that mix is exactly what makes the current setup interesting. The RSI at 58.9 is neutral, which means the stock is not yet in an overbought state on that measure and still has room to extend if demand remains steady. But the Stochastic %K at 93.5 versus %D at 62.8 is clearly overbought, which often means the latest price rise has moved faster than the underlying trend can comfortably sustain. In other words, the stock is not necessarily weak; it is simply showing signs of being locally extended.
Momentum confirmation comes from the trend-following side. The MACD at 0.521, above the signal line at 0.013, with a histogram of 0.508, points to positive momentum still in force. That combination usually means the recent advance has not yet lost its engine. Still, because the stochastic is already overheated while RSI remains only neutral, the chart is showing a familiar tension: trend momentum is positive, but the shorter-term oscillator is warning that the move may need a pause.
Volatility & Volume
Bollinger Bands add another layer to that story. TMUS is trading above the upper band at 186.45, with %B at 107%, which means price has pushed beyond the normal statistical envelope of the recent 20-day range. That is often a sign of strength, but it can also mean the move is running hot. The more constructive detail is that the band width is only 6.5% and is squeezing, which suggests volatility has compressed and a larger directional move may be building. A squeeze does not tell you direction by itself; it tells you the market is storing energy.
The volume backdrop supports the breakout attempt, but not without a caveat. Last volume was 6,034,800, around 1.5× the 20-hour average of 4,049,230, so participation is clearly better than usual. That is a constructive signal because moves backed by stronger volume are more likely to attract follow-through. However, OBV is down, and that matters. On-balance volume is a running measure of whether volume has been accumulated on up days or distributed on down days. A falling OBV while price rises can mean the advance is not yet fully supported by broad accumulation, even if the latest session was active.
ATR(14) at 4.12, or 2.2% of price, indicates moderate volatility. So while the band squeeze hints at a coming expansion, the day-to-day swings are still contained enough that the next move could develop quickly if a catalyst arrives.
Key Levels & Scenarios
The immediate battleground is straightforward. Resistance at 187.30 is now being tested because price is sitting right on it. If TMUS can hold above that zone, the chart would begin to shift from a range-bound recovery toward a more credible breakout attempt. If it fails to hold, the market likely falls back toward 186.45 at the upper Bollinger band and then toward the 180.58 area around the SMA20 and Bollinger middle line, which is also the most visible short-term pivot on the chart.
The lower edge of the recent range is 173.46, and that level matters because it marks the line where the current advance would start to look like a failed breakout rather than a healthy consolidation. With the stock already at the top of its range, the risk is not collapse so much as a return to the mean if momentum cools faster than buyers can renew it.
Technical Verdict: HOLD (wait & see)
HOLD (wait & see) fits the chart best because the trend has improved, but the stock is also stretched at resistance and showing mixed momentum.
- Positive MACD and price above SMA20/SMA50 support the advance.
- Stochastic overbought and price above the upper Bollinger band warn that the move is extended.
- OBV down keeps the breakout case from looking fully confirmed.
- Ideal entry range: 180.58 to 186.45
- Exit target: 187.30 first, then 198.86 if strength persists
- Stop-loss protection: 173.46
This verdict is invalidated if price falls below 173.46, because that would break the current range floor and weaken the breakout structure.
For non-traders, the chart says TMUS is strong enough to watch, but not yet clean enough to call settled.
“It’s right at the edge now — either the market proves the breakout, or it slips back into the range.”
Summary Data TMUS
| Last price | 187.30 USD |
| Change 1 day / 5 days / 1 month | 2.82% / 3.13% / 5.69% |
| Trend / MA-cross | sideways / none |
| SMA20 / SMA50 | 180.58 / 181.34 |
| RSI (14) / Stochastic %K | 58.9 / 93.5 |
| Bollinger %B / ATR | 107% / 4.12 |
| Support / Resistance 20 days | 173.46 / 187.30 |
| Data as of | 2 September 2026 20:30 WIB |
Track TMUS stock price daily: live levels, support/resistance and our full TMUS analysis history.