KO Stock Drops 3.96% Today, Momentum Weakens
On Juli 20, 2026: price 81.56 USD, trend sideways, RSI 48.4, support 79.39, resistance 84.92. technical analysis of ko stock. KO Stock Drops — full details…

Coca-Cola shares closed at $81.56 on 17 July 2026, down 3.96% in a single session from a previous close of $84.92, according to exchange data via Yahoo Finance. For a defensive, low-volatility name, that is not noise. The fall was accompanied by 32.9 million shares changing hands — roughly 1.6 times the 20-day average of 20.9 million — a signature of institutional distribution rather than retail drift. One heavy day does not break a trend, but it does change the conversation.
Trend & Price Action
The broader structure remains officially sideways: the SMA20 slope is a barely-there +0.61% over five days, and there is no fresh moving-average cross. What matters is where the price now sits. KO has slipped below the SMA20 at $82.25 but is still holding above the SMA50 at $81.06 — sandwiched between the two averages, which is the market's way of saying it has not decided anything yet.
The scale of Thursday's move deserves emphasis. The $3.36 drop is roughly 1.7 times the 14-day ATR of $1.96, meaning the stock traveled nearly two average daily ranges in one session. Moves of that size tend to either mark capitulation or the start of a leg lower — rarely something in between. Price now sits at 39% of its 20-day range, with the Bollinger %B also at 39%, confirming the stock is leaning toward the lower half of its recent envelope without yet being statistically cheap.
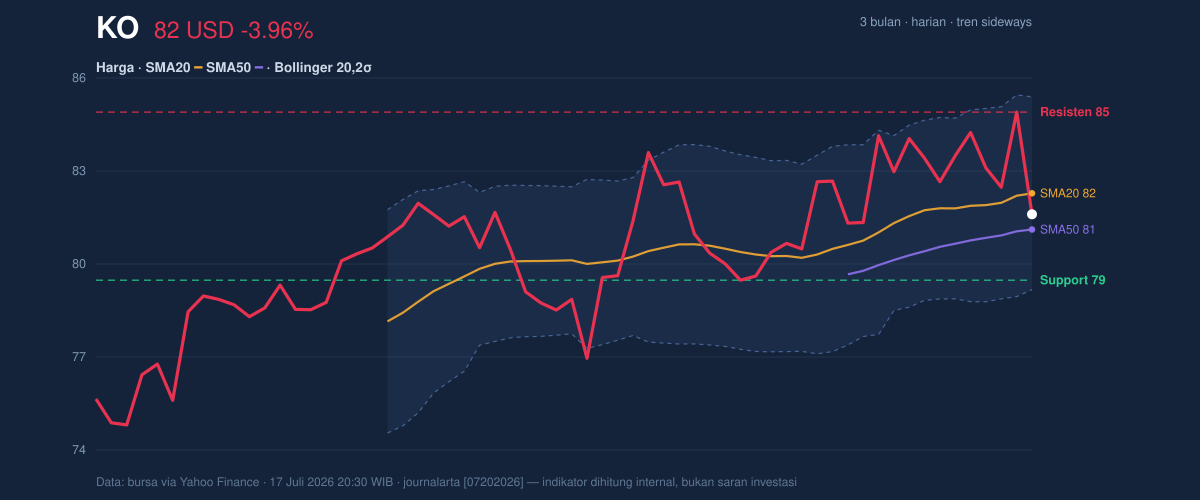
As shown in the chart, the $79.39 support and the lower Bollinger band at $79.08 form a tight demand cluster directly below the current price.
Oscillators & Momentum
Momentum signals are split, and the split itself is the story. The RSI at 48.4 is dead neutral — Thursday's drop pulled it back from mid-range, offering no edge in either direction. The Stochastic, however, is oversold at %K 15.1, a level that typically means sellers have become short-term stretched. The catch: %K remains below %D (47.7), so no bullish crossover has formed yet. Oversold is a condition, not a trigger.
The MACD histogram has flipped negative at -0.088, with the MACD line (0.744) crossing below its signal (0.833) — a fresh downside crossover that aligns with the heavy-volume selloff. Both lines remain above zero, which softens the signal: this is momentum decelerating within an uptrend, not yet a confirmed downtrend.
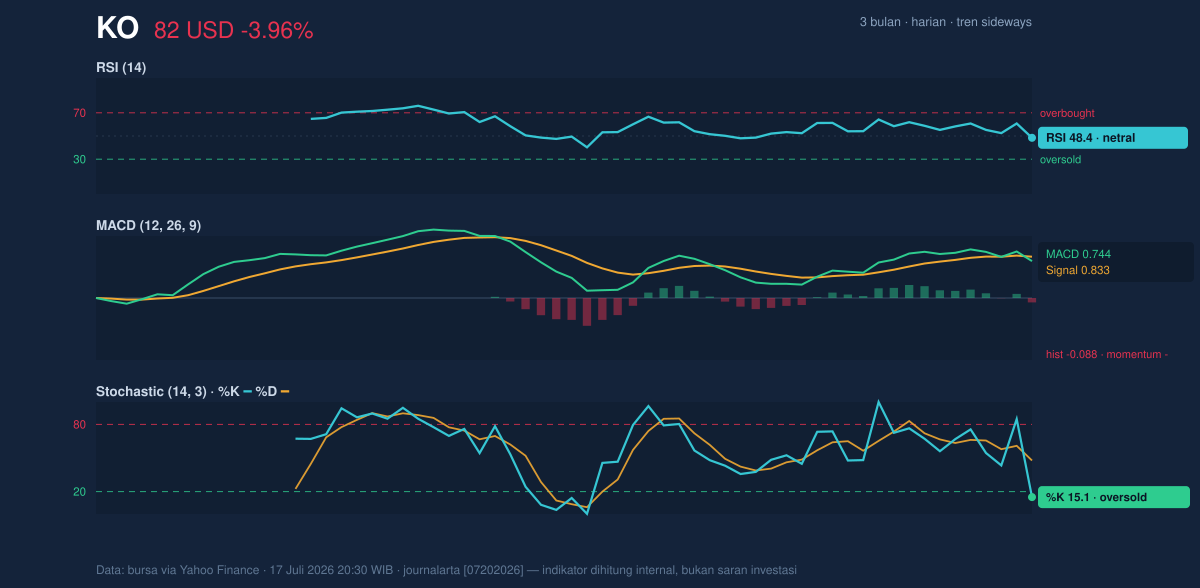
As the momentum chart shows, the fast oscillator is stretched to the downside while the slower MACD has only just rolled over — an awkward combination that usually resolves with either a quick bounce or a breakdown, not quiet consolidation.
Volatility & Volume
The Bollinger band width has compressed to 7.7% — a squeeze, as visible in the price chart. Squeezes store energy: they tell traders a decisive move is coming, but not which way. Thursday's drop may prove to be the opening act of that resolution. With ATR at 2.4% of price, volatility is moderate but the range is clearly waking up.
Volume is the loudest signal in the dataset. A down day on 1.6× average volume, paired with a declining On-Balance Volume, means real money is leaving the stock, not just paper mark-downs. When price falls on expanding volume and OBV confirms, the burden of proof shifts to the bulls.
Key Levels & Scenarios
The map is clean. Support sits at $79.39, reinforced by the lower Bollinger band at $79.08 — a zone where an oversold Stochastic could plausibly produce a bounce. Resistance sits at $84.92, which is pointedly the previous close itself; the level the market fell from now becomes the ceiling it must reclaim. Above that, the upper band at $85.42 and the three-month high at $85.68 cap any recovery attempt.
Two conditional paths follow. If $79.08–$79.39 fails on a closing basis, the squeeze resolves downward and the three-month low at $74.55 re-enters the frame. If KO reclaims the SMA20 at $82.25, the bearish momentum signal is neutralized and a retest of $84.92 becomes the base case.
Technical Verdict: HOLD
HOLD (wait & see) — the indicators argue for patience, not action. Three reasons stand out:
1. Distribution volume and falling OBV cap the upside case; rallies into $84.92 are suspect until participation improves.
2. The negative MACD histogram warns that momentum has just turned, making fresh longs premature.
3. The oversold Stochastic plus price holding above the SMA50 makes chasing the downside equally poor risk/reward — sellers are stretched, and support is one ATR away.
Verdict invalidated if price closes below $79.08 (the lower Bollinger band), which would flip the bias bearish toward the $74.55 three-month low.
- Entry range: $79.10–$79.40, only on evidence of stabilization (a Stochastic bullish cross or a volume-dry-up session at support)
- Exit target: $84.92 (20-day resistance), with $85.42 as the stretch objective at the upper band
- Stop loss protection: a close below $79.08, which breaks both the band and the support cluster simultaneously
In plain terms: the stock just took a heavy hit on heavy volume, but it is sitting directly on the floor that should matter — this is a moment to watch the $79 level, not to act on emotion. This is technical analysis, not an investment recommendation; the site disclaimer applies. The next scheduled checkpoint is the behavior of OBV and the Stochastic cross in the coming sessions — that pairing will reveal whether Thursday was capitulation or a warning shot.
Summary Data KO
| Last price | 81.56 USD |
| Change 1 day / 5 days / 1 month | -3.96% / -2.31% / 2.04% |
| Trend / MA-cross | sideways / none |
| SMA20 / SMA50 | 82.25 / 81.06 |
| RSI (14) / Stochastic %K | 48.4 / 15.1 |
| Bollinger %B / ATR | 39% / 1.96 |
| Support / Resistance 20 days | 79.39 / 84.92 |
| Data as of | 17 Juli 2026 20:30 WIB |


