HSBC Stock Analysis: Gains 1.97%, Testing Key Resistance
On September 4, 2026: price 1,563.60 GBp, trend sideways, RSI 57.2, support 1,497.20, resistance 1,545.20. technical analysis of hsbc stock.
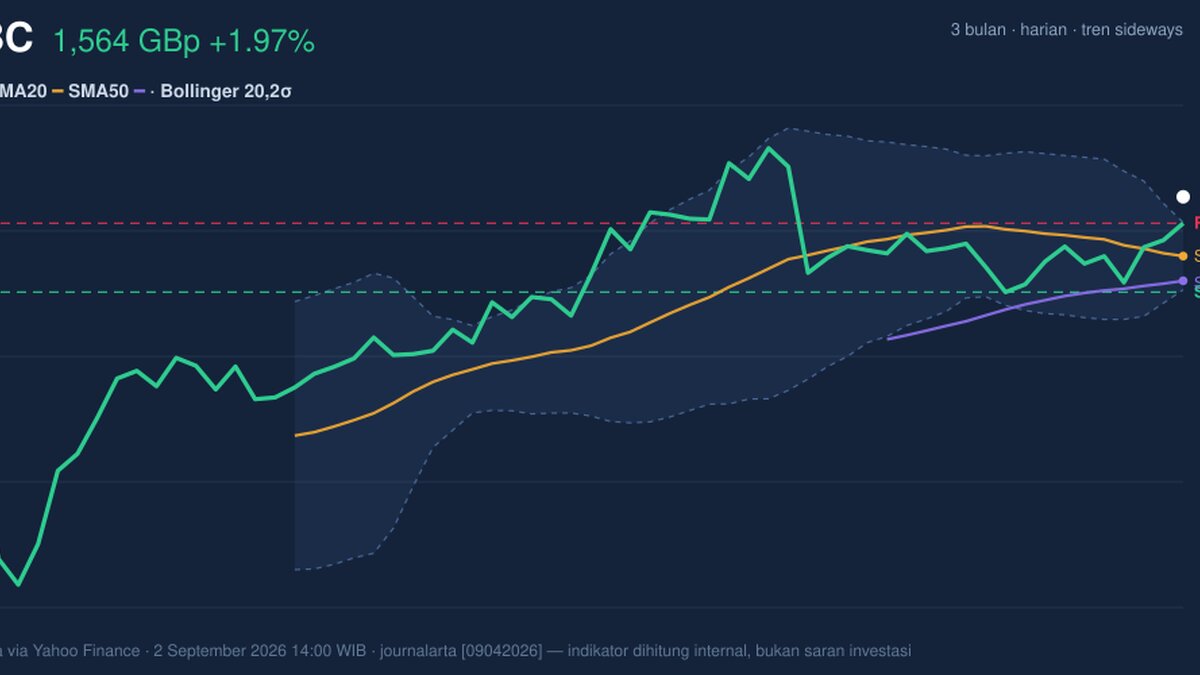
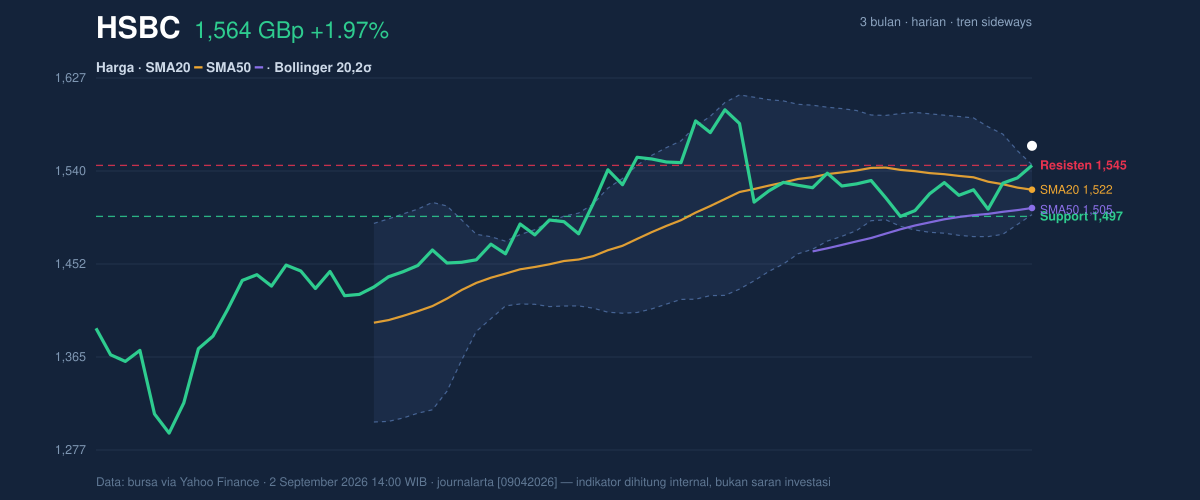
HSBC Holdings ended at 1,563.60 GBp on 2 September 2026, up 1.97% on the day and back above both its short- and medium-term averages, but the tape is sending a more mixed message than the headline gain suggests. The shares are trading above the SMA20 at 1,522.30 and the SMA50 at 1,505.12, which usually signals that buyers still have the upper hand in the broader trend. Yet the stock is also sitting above the upper Bollinger band at 1,545.75, with %B at 138%, a sign the move has stretched beyond the recent volatility envelope. That often means momentum is strong, but also that the next move can become more erratic as traders test whether the breakout has real follow-through.
Trend & Price Action
The main trend remains sideways, and the SMA20 slope of -0.85% over 5 days shows the short-term average is still leaning lower even though price has pushed above it. That combination matters: it says the stock has recovered from weakness, but not yet enough to establish a clean new upward trend. There has been no new MA-cross, so the chart has not delivered the kind of moving-average confirmation that typically marks a more durable shift in direction. As shown in the chart, HSBC is now trading near the upper end of its recent range and not far below the 3-month high of 1,610.00, which keeps the market focused on whether this is a genuine push higher or just a short-lived overshoot.
Short version: the trend has improved, but it has not fully repaired.
Another useful signal is the position versus the recent range. The stock’s 20-hour support at 1,497.20 and 20-hour resistance at 1,545.20 frame the current move, and the price being at 138% of the range means it has already moved past the top of that band. That does not automatically imply reversal, but it does indicate the market is pricing in a stronger move than the recent range has comfortably accommodated. When a stock sits this far above its short-term range, follow-through matters more than the day’s gain itself.
Oscillators & Momentum
Momentum is where the chart becomes more cautious. The RSI at 57.2 is neutral, which means the stock is not yet in a classic overbought condition on that measure. But the Stochastic %K at 90.6 and %D at 77.7 are both elevated, with the faster line already in overbought territory. In plain English, that says the recent rise has been strong enough to push the short-term oscillator close to exhaustion, even if the broader momentum gauge has not flashed a full warning. The most important cross-check is the MACD at 4.799 below its signal line at 5.149, leaving a -0.350 histogram. That is a negative momentum reading: price can still rise, but the internal thrust behind the move is not as strong as the price action alone might suggest.
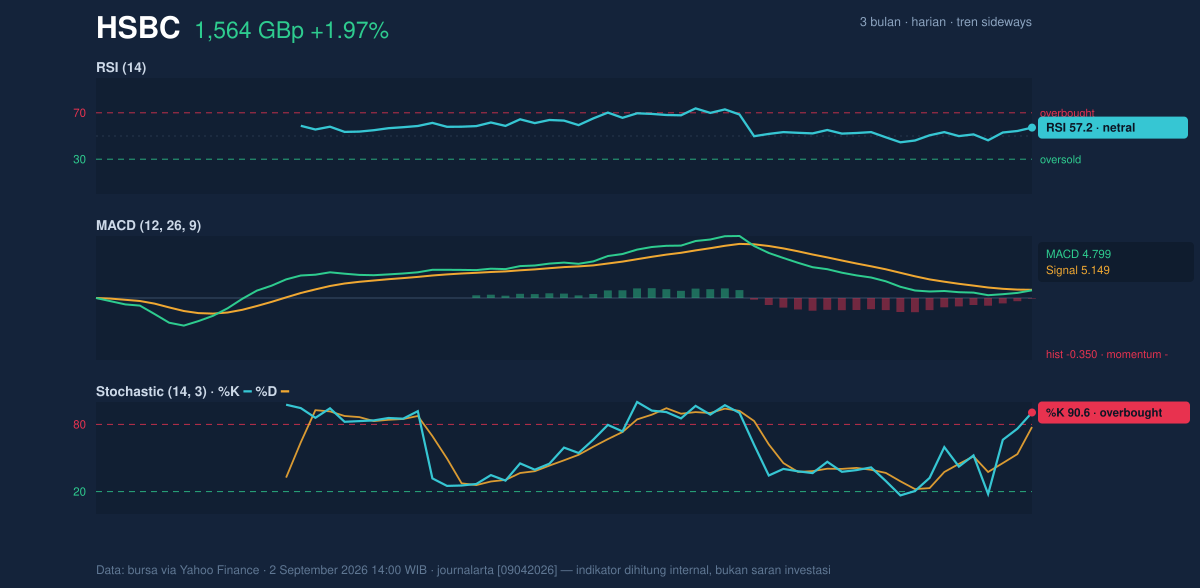
That split between price and momentum is the key signal in this report.
In practical terms, the chart is showing a market that has rallied above its averages while the oscillator set is already stretched and the MACD has not confirmed the advance. That kind of setup often produces either a brief pause, a sideways consolidation, or a sharp continuation if fresh buying appears. The difference between those outcomes is usually volume.
Volatility & Volume
Volatility is moderate, with ATR(14) at 25.01, equal to 1.6% of price. ATR measures the typical daily movement, so this reading suggests HSBC can still move decisively, but it is not in a highly turbulent phase. The Bollinger band setup is more notable: the bands are narrow, with 3.1% width, and that is described as a squeeze. A squeeze means volatility has compressed, often before a breakout or breakdown. Because price is already above the upper band, the market is leaning toward expansion rather than contraction, but the negative MACD histogram tempers the enthusiasm. In other words, the squeeze is real, but the direction is not fully settled.
Volume does not yet provide strong confirmation. Last volume was 20,238,540, below the 20-hour average of 25,097,744, or 0.8× normal. That matters because a breakout on light participation can fade quickly. Still, OBV is rising, which means cumulative volume flow has been improving even if the latest session was not especially heavy. Rising OBV tells you money has been quietly accumulating over time; the subdued latest volume says the market has not yet shown urgency.
Key Levels & Scenarios
The immediate technical map is clear. The first area to watch is the 1,545.20 resistance zone, which lines up closely with the 1,545.75 upper Bollinger band. If price can hold above that area, the chart would be signaling that the squeeze is resolving upward and that the recent stretch above the band is becoming a more credible breakout attempt. Above that, the next reference is the 3-month high at 1,610.00. On the downside, the most important near-term floor is the 1,522.30 SMA20, followed by the 1,505.12 SMA50 and then the 1,497.20 support. A drop back below those levels would show that the current move has lost altitude and that the sideways trend is still controlling the bigger picture.
The core signal is a constructive price recovery that is not yet fully confirmed by momentum or volume.
Technical Verdict: HOLD (wait & see)
HOLD (wait & see) fits best because:
- Price is above SMA20 and SMA50, which supports the trend, but the SMA20 is still sloping lower, so the recovery is not fully established.
- Stochastic is overbought and the MACD histogram is negative, showing momentum is stretched and not fully confirming the rise.
- Bollinger bands are in a squeeze, which often precedes a stronger move, but volume is only 0.8× normal, so the breakout case is not yet backed by strong participation.
Verdict invalidated if price falls below 1,497.20, because that would break the nearest support and pull HSBC back into the lower part of its recent range.
- Ideal Entry Range: 1,522.30 to 1,545.20
- Exit Target (Target Price): 1,610.00
- Stop Loss protection: below 1,497.20
In plain English, the shares look firmer than they did a few sessions ago, but the chart still needs confirmation before the move can be treated as durable.
2 September 2026 14:00 WIB: HSBA.L last traded at 1,563.60 GBp, with the 3-month high at 1,610.00.
Summary Data HSBC
| Last price | 1,563.60 GBp |
| Change 1 day / 5 days / 1 month | 1.97% / 3.07% / -1.33% |
| Trend / MA-cross | sideways / none |
| SMA20 / SMA50 | 1,522.30 / 1,505.12 |
| RSI (14) / Stochastic %K | 57.2 / 90.6 |
| Bollinger %B / ATR | 138% / 25.01 |
| Support / Resistance 20 days | 1,497.20 / 1,545.20 |
| Data as of | 2 September 2026 14:00 WIB |
Track HSBC share price daily: live levels, support/resistance and our full HSBC analysis history.