Shell Stock Drops 0.03%, Testing Key Resistance In Focus
On September 4, 2026: price 3,431.50 GBp, trend sideways, RSI 61.2, support 3,277.50, resistance 3,443.00. technical analysis of shell stock.
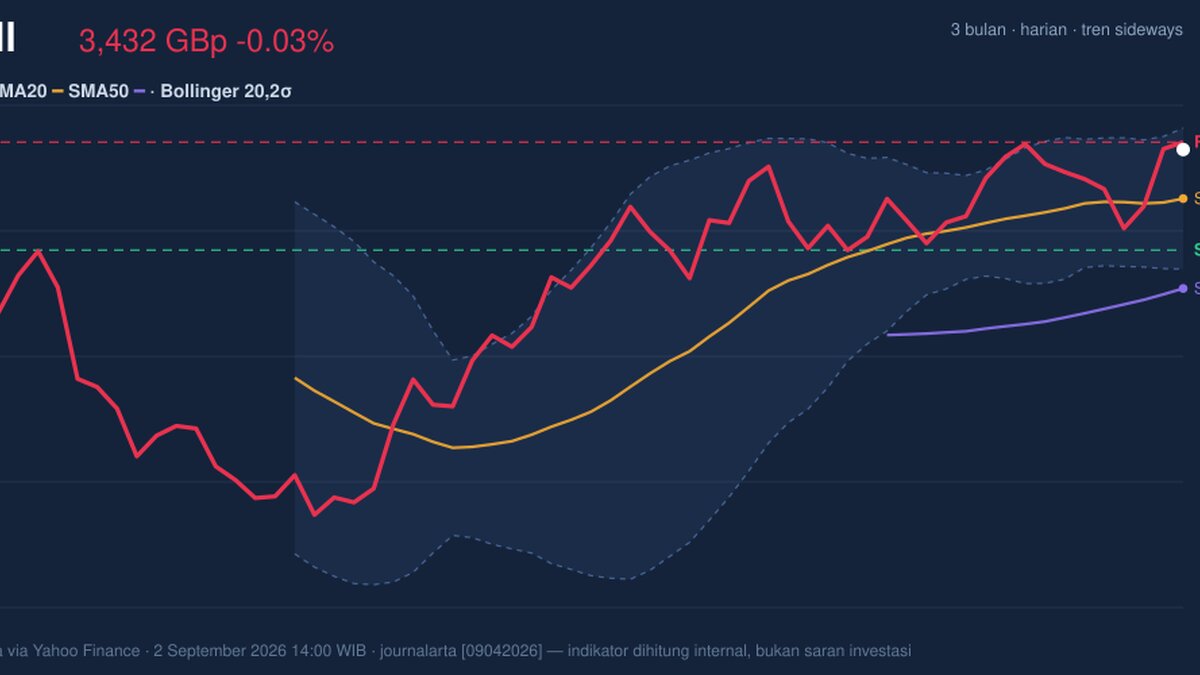
Shell plc edged lower on the London Stock Exchange on 2 September 2026, with the shares last changing hands at 3,431.50 GBp, almost unchanged from the previous close of 3,432.50. The move looks modest on the surface, but the chart says the market is testing the upper half of its recent range while momentum starts to wobble beneath the price, a combination that often matters more than the day’s headline change.
Trend & Price Action
The broader structure remains sideways, but not directionless. Price is trading above the SMA20 at 3,356.53 and well above the SMA50 at 3,218.82, which tells us the medium-term trend is still intact even if it is not accelerating. The SMA20 slope of 0.22% over five days suggests the trend is gently rising rather than breaking out, and the lack of a new MA-cross means the moving averages are not sending a fresh trend signal either.
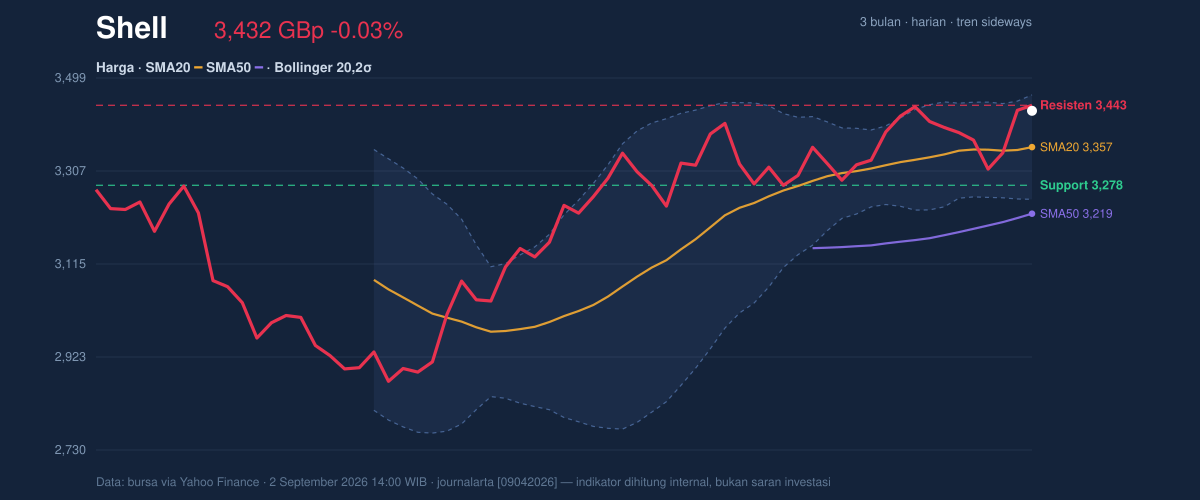
That matters because Shell is now sitting close to the top of its recent band. The shares are at 93% of the 20-hour range, with support at 3,277.50 and resistance at 3,443.00, while the 3-month range of 2,559.50 to 3,758.50 shows there is still room above if buyers can force a clean move. In plain terms: the stock is not cheap, but it is also not stretched into a long-term peak; it is pressing against a near-term ceiling.
The Bollinger Bands sharpen that picture. Price is near the upper band at 3,464.38, with %B at 85%, which means the share price is occupying the upper part of the band structure rather than the middle. Yet the band width is only 6.4%, a squeeze that signals compressed trading conditions and a higher chance of a sharper move once the market chooses direction. A squeeze does not predict up or down; it means the next move can be more forceful than the recent drift.
Oscillators & Momentum
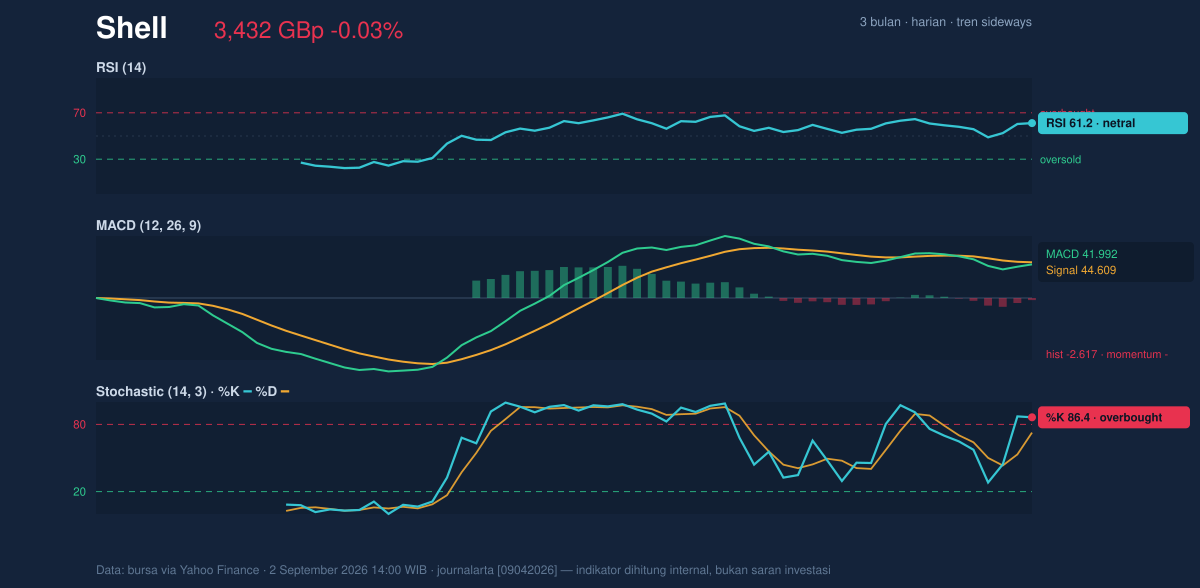
The oscillators are mixed, and that mix is the key message. RSI at 61.2 is still neutral, so the stock is not in a classic overbought condition on that measure. But Stochastic %K at 86.4 and %D at 72.6 are already in overbought territory, which usually means short-term enthusiasm has run ahead of itself. That does not automatically imply a reversal, but it does warn that upside may need fresh volume to continue.
The MACD is less forgiving. MACD at 41.992 is below the signal line at 44.609, and the histogram at -2.617 shows momentum has turned negative even while price remains elevated. This is the classic “price holds, momentum softens” setup. It often appears before consolidation, and sometimes before a pullback, because buyers are still present but no longer pushing with the same conviction.
Volatility & Volume
Volatility is moderate rather than explosive, with ATR(14) at 53.57, or 1.6% of price. That suggests daily swings are present, but not disorderly. Combined with the Bollinger squeeze, this points to a market that is coiling rather than breaking apart.
The volume profile is more constructive than the oscillator set. Last volume of 33,134,300 was 3.1 times the 20-hour average of 10,782,511, and OBV is rising. That combination says participation is real, not thin, and that buyers have been willing to absorb supply. In technical terms, OBV rising while price holds near resistance can support a continuation attempt; if volume fades here, the same setup can quickly turn into exhaustion.
Key Levels & Scenarios
The immediate test is simple: 3,443.00 resistance is the nearby barrier, and 3,277.50 support is the first line that would show whether the current range is still holding. A move through resistance would open the way toward the upper Bollinger band at 3,464.38, while failure to hold support would shift attention back toward the SMA20 at 3,356.53 and then the SMA50 at 3,218.82.
The signal to watch is not just whether Shell rises, but whether it can do so with momentum confirmation. Right now, price is acting stronger than MACD, and Stochastic is already stretched. That mismatch usually means the market is vulnerable to either a brief pullback or a sideways pause before any fresh advance can prove itself.
Technical Verdict: HOLD (wait & see)
HOLD (wait & see)
- Reason 1: Price remains above SMA20 at 3,356.53 and SMA50 at 3,218.82, so the medium-term structure is still constructive.
- Reason 2: MACD is below signal with a negative histogram, showing momentum is weakening even as price trades near the top of the range.
- Reason 3: Stochastic is overbought and price is pressing near resistance at 3,443.00, so near-term upside looks less clean without a fresh catalyst.
- Verdict invalidated if price breaks below 3,277.50, which would weaken the current range structure and increase the odds of a deeper retracement.
- Ideal Entry Range: 3,356.53 to 3,277.50
- Exit Target (Target Price): 3,443.00 to 3,464.38
- Stop Loss protection: below 3,277.50
For non-traders, this means Shell is still holding up, but the chart is asking for proof before the next move becomes convincing.
“The market is close enough to resistance that one more push could matter, but momentum is already saying not to trust the move blindly.”
Summary Data Shell
| Last price | 3,431.50 GBp |
| Change 1 day / 5 days / 1 month | -0.03% / 1.33% / 3.31% |
| Trend / MA-cross | sideways / none |
| SMA20 / SMA50 | 3,356.53 / 3,218.82 |
| RSI (14) / Stochastic %K | 61.2 / 86.4 |
| Bollinger %B / ATR | 85% / 53.57 |
| Support / Resistance 20 days | 3,277.50 / 3,443.00 |
| Data as of | 2 September 2026 14:00 WIB |
Track Shell share price daily: live levels, support/resistance and our full Shell analysis history.