BP Stock Drops 0.30% Today, Momentum Weakens
On September 4, 2026: price 539.70 GBp, trend sideways, RSI 56.1, support 514.50, resistance 552.20. technical analysis of bp stock. BP Stock Drops — full…
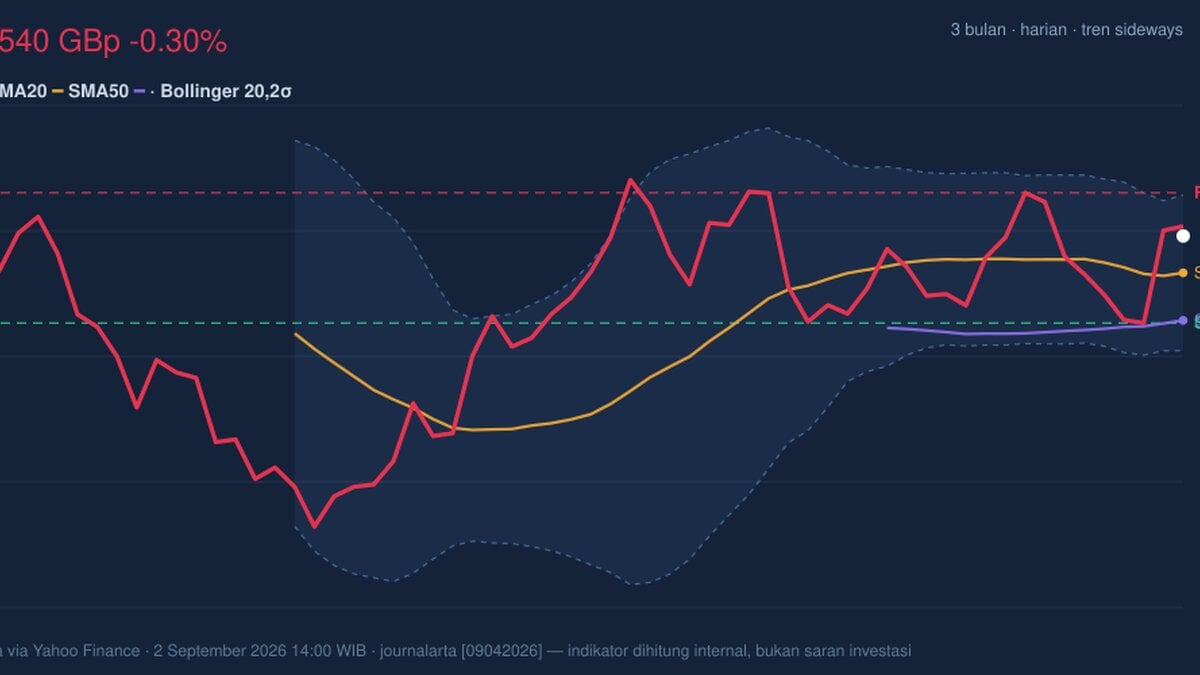
BP plc is holding above its short- and medium-term averages, but the latest momentum readings suggest the move is still fragile rather than decisive. The shares ended at 539.70 GBp on LSE, down 0.30% on the day, even though the stock is still up 2.10% over 5 days and 2.80% over 1 month, according to exchange data cited in Yahoo Finance. That mix matters: it says buyers have recently been willing to step in, but the tape is not yet showing broad conviction.
Trend & Price Action
BP is trading in a sideways trend, with the SMA20 at 529.06 and the SMA50 at 515.28. The fact that price sits above SMA20 and well above SMA50 tells us the shares are not under structural pressure; the medium-term base remains intact. But the chart also shows the SMA20 slope at -0.75% over 5 days, which is a subtle warning that the near-term push has lost some momentum.
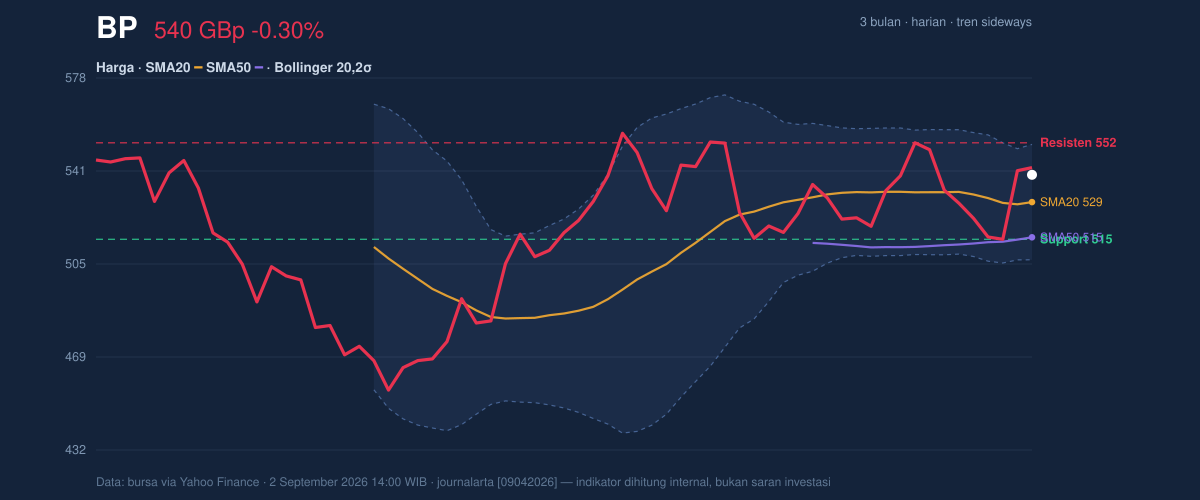
That combination is important. Price above both moving averages usually signals that sellers have not regained control, yet a flat-to-softening short average means the stock is not accelerating higher either. The 20-hour support at 514.50 and 20-hour resistance at 552.20 frame the current range clearly, and BP is sitting at about 67% of that range. In plain terms, the stock is closer to the upper half of its recent band, but not close enough to say it has broken out. The 3-month high of 562.90 is the next obvious ceiling, while 450.60 marks the lower end of the broader swing range.
Oscillators & Momentum
The momentum tools are mixed, and that is the key message from the chart.
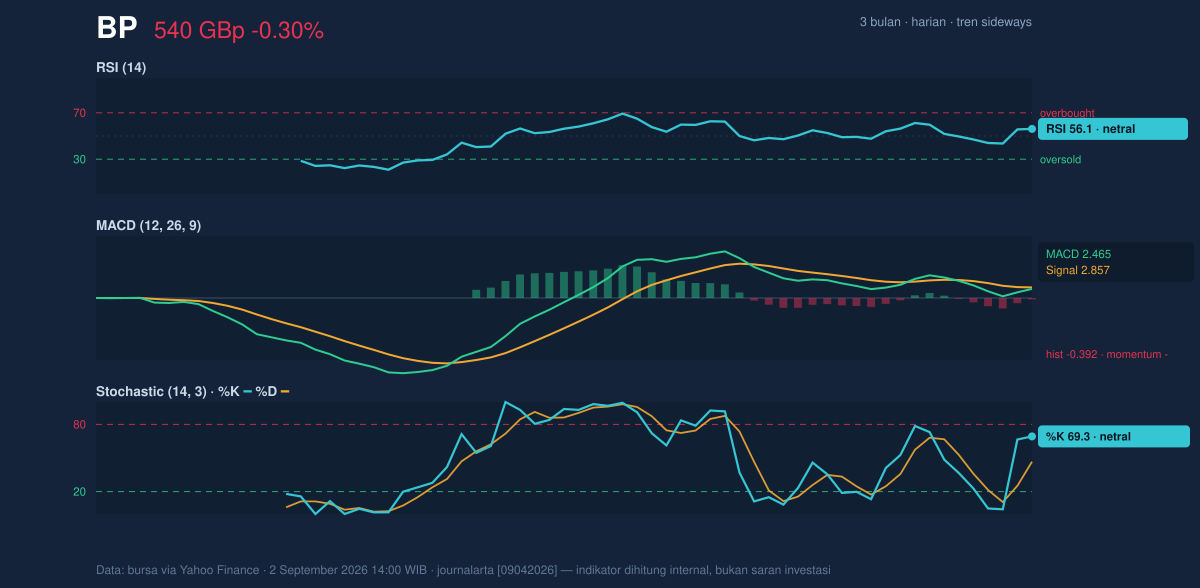
The RSI at 56.1 is neutral, which means BP is neither stretched nor oversold. This is usually a constructive position, because it leaves room for further gains without immediate overbought risk. The Stochastic %K at 69.3 and %D at 46.7 also sit in neutral territory, but the gap between the two lines suggests short-term upward pressure has improved faster than the broader signal line. That often appears when a stock is trying to build momentum, though it is not yet a clean breakout signal.
The more cautionary reading comes from MACD. BP’s MACD at 2.465 remains below its signal line at 2.857, leaving a histogram of -0.392. In practical terms, that means the recent price lift has not fully converted into trend confirmation. MACD is often used to gauge whether momentum is strengthening or fading; here, it says the advance is still unproven. The stock may be holding up, but the internal thrust is weaker than the price alone suggests.
Volatility & Volume
Volatility is present, but not extreme. The ATR(14) of 13.60, equal to about 2.5% of price, points to moderate daily movement. That matters because it suggests BP can still travel meaningfully within a session, but without the kind of wide swings that usually accompany panic or a strong trend phase.
The Bollinger Bands add another layer. BP’s %B at 74% places the shares in the upper part of the band structure, but not at the outer edge. The upper band at 551.59 is close to the 20-hour resistance at 552.20, so the chart is effectively showing the same message from two different methods: the stock is testing the top of its recent range, but has not yet forced a clean move beyond it. The band width of 8.5% is normal, not squeezed. That means the market is not sitting in a coiled spring setup; it is already in a regular trading rhythm, where continuation or rejection can happen without a dramatic volatility expansion first.
Volume is the other caution flag. Latest volume of 31,416,097 was only 0.6x normal versus the 20-hour average of 51,697,622, and OBV is falling. OBV, or on-balance volume, tracks whether trading volume is supporting price direction. A declining OBV while price holds up tells us participation is not confirming the move. In simple terms: the shares are rising on less commitment than would usually be seen in a convincing advance.
Key Levels & Scenarios
The chart’s levels are fairly clean. Support at 529.06 — the SMA20 and Bollinger middle band — is the first line that matters. If BP loses that area, the stock would be signalling that the recent rebound is fading back into the middle of its range. Below that, 514.50 is the next important support, and a failure there would put the broader base under pressure.
On the upside, 552.20 is the immediate resistance to watch, sitting just above the 551.59 upper Bollinger band. A move through that zone would shift the market from range-trading toward a test of the 562.90 3-month high. Until that happens, the stock is best described as capped by overhead supply.
Technical Verdict: HOLD (wait & see)
HOLD (wait & see)
- Reason 1: Price remains above SMA20 529.06 and SMA50 515.28, so the broader structure is still intact.
- Reason 2: MACD is negative versus its signal line, which means momentum is not yet confirming the price’s position above support.
- Reason 3: Volume is only 0.6x normal and OBV is down, so the recent lift lacks strong participation.
- Verdict invalidated if price falls below 514.50, because that would break the nearest support and weaken the current range structure.
- Ideal Entry Range: 529.06 to 514.50
- Exit Target: 552.20 to 562.90
- Stop Loss protection: below 514.50
In plain English: BP is holding its ground, but the chart still needs stronger volume and momentum before the move can be treated as more than a range-bound bounce. The next scheduled reference point is the market’s reaction around 552.20 resistance and the 562.90 three-month high.
Summary Data BP
| Last price | 539.70 GBp |
| Change 1 day / 5 days / 1 month | -0.30% / 2.10% / 2.80% |
| Trend / MA-cross | sideways / none |
| SMA20 / SMA50 | 529.06 / 515.28 |
| RSI (14) / Stochastic %K | 56.1 / 69.3 |
| Bollinger %B / ATR | 74% / 13.60 |
| Support / Resistance 20 days | 514.50 / 552.20 |
| Data as of | 2 September 2026 14:00 WIB |
Track BP share price daily: live levels, support/resistance and our full BP analysis history.