HSBC Stock Analysis: Gains 0.55%, Testing Key Resistance
On September 4, 2026: price 163.50 HKD, trend sideways, RSI 56.9, support 160.30, resistance 163.50. technical analysis of hsbc stock. HSBC Stock Analysis —…
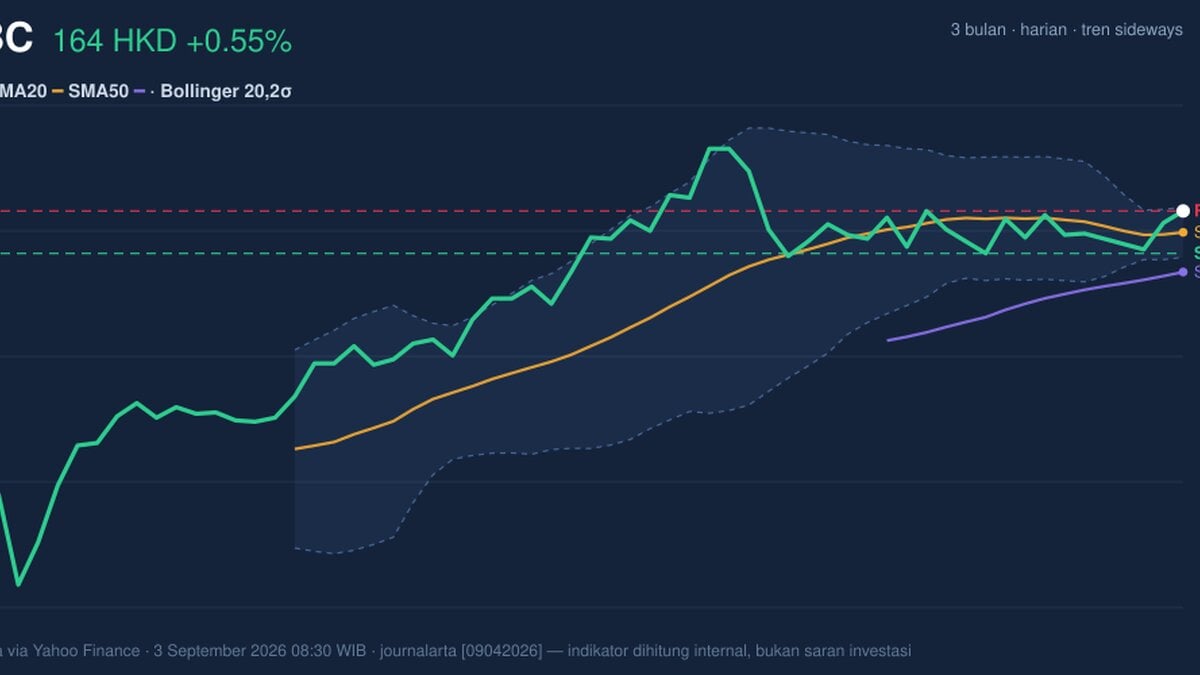
HSBC Holdings’ Hong Kong-listed shares finished at HKD 163.50, up 0.55% from the previous close of 162.60, and the move matters less for the size than for where it landed: the stock is now sitting at the very top of its 20-hour range, with price pressing against 163.50 resistance and the upper Bollinger band at 163.79, as shown in the chart. That combination usually signals a market that is no longer drifting, but testing whether recent demand is strong enough to force a fresh leg higher. The catch is that the technical picture is not fully aligned yet: trend is still described as sideways, the SMA20 is edging lower, and momentum indicators are mixed rather than decisive.
Trend & Price Action
Price is trading above both the SMA20 at 161.89 and the SMA50 at 158.89, which tells traders the share price remains above its short- and medium-term averages even though the slope of the SMA20 is -0.49% over 5 days. That negative slope is important: it shows the recent average price is still easing lower, so the stock is not in a clean uptrend despite holding above the averages. In practical terms, the market is trying to stabilize above support rather than accelerating away from it. The absence of a new MA-cross also means there has been no fresh signal from the moving averages to confirm a trend shift.
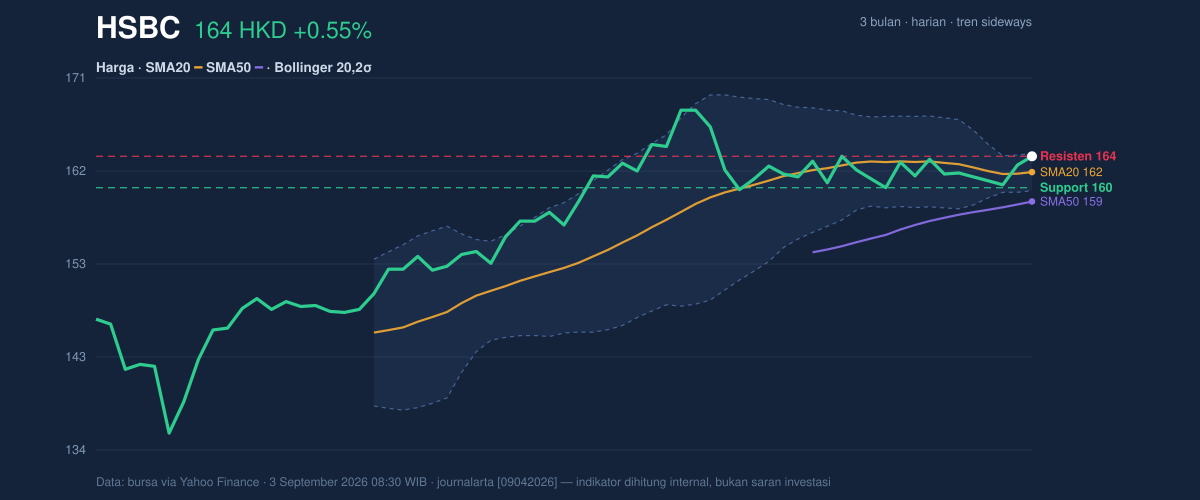
The price is also near the top of its 3-month range, with the high at 169.70 and the low at 133.50. That places HSBC in the upper part of its recent trading band, but still below the prior peak, which is a classic “push but not break” setup. The fact that the stock is holding near the ceiling of the 20-hour range at 163.50 suggests buyers are active; whether they are strong enough to absorb supply at this level is the key question.
Oscillators & Momentum
The momentum picture is less clean than the price action. The RSI(14) at 56.9 is neutral, which means the stock is not overbought and still has room to extend if demand improves. The Stochastic %K at 78.3 versus %D at 60.7 shows the short-term oscillator leaning higher, but not in a fully confirmed breakout posture. In other words, short-term buying pressure is present, yet it has not turned into a strong, synchronized momentum thrust. That matters because stocks can sit near resistance with a high stochastic reading for a while before either breaking through or rolling over.
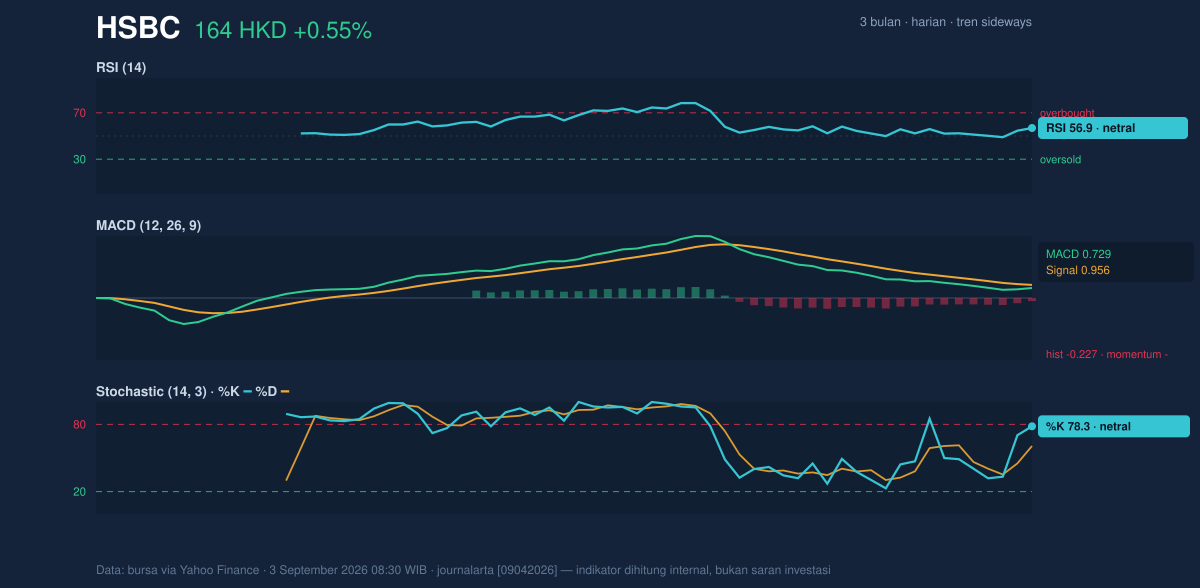
The biggest caution comes from MACD at 0.729, below the signal line at 0.956, with a histogram of -0.227. That negative histogram means the faster trend measure is running behind the slower one, so momentum is still lagging even as price edges higher. Put simply, the share price is trying to climb, but the internal engine has not fully caught up. This is the kind of divergence that often appears when a stock is consolidating near resistance rather than launching decisively.
Volatility & Volume
Volatility is subdued. The ATR(14) at 2.31, or 1.4% of price, indicates relatively low daily movement, which usually makes breakouts harder to ignore once they happen because the stock has not been swinging widely. The Bollinger Band structure reinforces that point: the upper band is 163.79, the middle band is 161.89, and the lower band is 160.00, while band width is just 2.3%. That is a squeeze setup, meaning price compression is building pressure for a larger move. The fact that %B is 92% shows price is already pressing into the upper part of the band, close to the ceiling. When a squeeze meets a high %B reading, the market is often telling you it is ready to choose a direction.
Volume adds a constructive note. The latest turnover of 13,990,143 shares was about 1.6× the 20-hour average of 8,698,869, and OBV is rising. That combination is useful because it suggests the latest move is not happening in thin trade. Rising on-balance volume means more shares are changing hands in a way that supports the price advance, which can help validate a breakout attempt if resistance gives way. For now, though, the stock is still testing the boundary rather than clearing it.
Key Levels & Scenarios
The immediate battle line is clear. Resistance at 163.50 is being tested now, while the nearest support sits at 160.30. The Bollinger upper band at 163.79 adds a second resistance reference just above the current price, and the Bollinger middle band at 161.89 overlaps with the SMA20, making that zone an important pivot if the stock slips. If price can hold above 163.50 and extend beyond 163.79, the chart would shift from compression into expansion, with the next reference coming from the upper end of the broader range near 169.70. If instead the stock fails to stay above 160.30, the current squeeze would lose force and the market would likely revert toward the mid-band area around 161.89 or lower.
Technical Verdict: HOLD (wait & see)
HOLD (wait & see) fits best because the stock is above its SMA20 and SMA50, volume is supportive, and OBV is rising, but MACD remains below signal and the trend is still sideways. The Bollinger squeeze and %B at 92% say a larger move may be approaching, yet the move has not been confirmed by momentum. The verdict is invalidated if price falls below 160.30, which would weaken the current range support and the squeeze structure.
- Ideal Entry Range: 161.89 to 163.50, where the SMA20/Bollinger mid-band and current resistance define the active decision zone.
- Exit Target: 163.79 first, then 169.70 if the upper band and resistance are cleared with follow-through.
- Stop Loss Protection: 160.30, the 20-hour support level.
Summary Data HSBC
| Last price | 163.50 HKD |
| Change 1 day / 5 days / 1 month | 0.55% / 1.05% / 2.12% |
| Trend / MA-cross | sideways / none |
| SMA20 / SMA50 | 161.89 / 158.89 |
| RSI (14) / Stochastic %K | 56.9 / 78.3 |
| Bollinger %B / ATR | 92% / 2.31 |
| Support / Resistance 20 days | 160.30 / 163.50 |
| Data as of | 3 September 2026 08:30 WIB |
Track HSBC share price daily: live levels, support/resistance and our full HSBC analysis history.