LLY Stock Technicals Today: Gains 0.85%, Momentum Weakens
On Juli 20, 2026: price 1,179.11 USD, trend uptrend, RSI 54.9, support 1,098.57, resistance 1,235.56. technical analysis of lly stock. LLY Stock Technicals —…

Eli Lilly shares closed the session at $1,179.11, up 0.85% on the day, according to NYSE data via Yahoo Finance as of 17 July 2026. The move extends a one-month gain of 6.04%, yet the five-day reading is still slightly negative at -0.80% — a telling split. The world's most valuable drugmaker is trending higher, but the engine behind the latest push is losing a bit of revs, and that tension is what the charts are really about right now.
Trend & Price Action
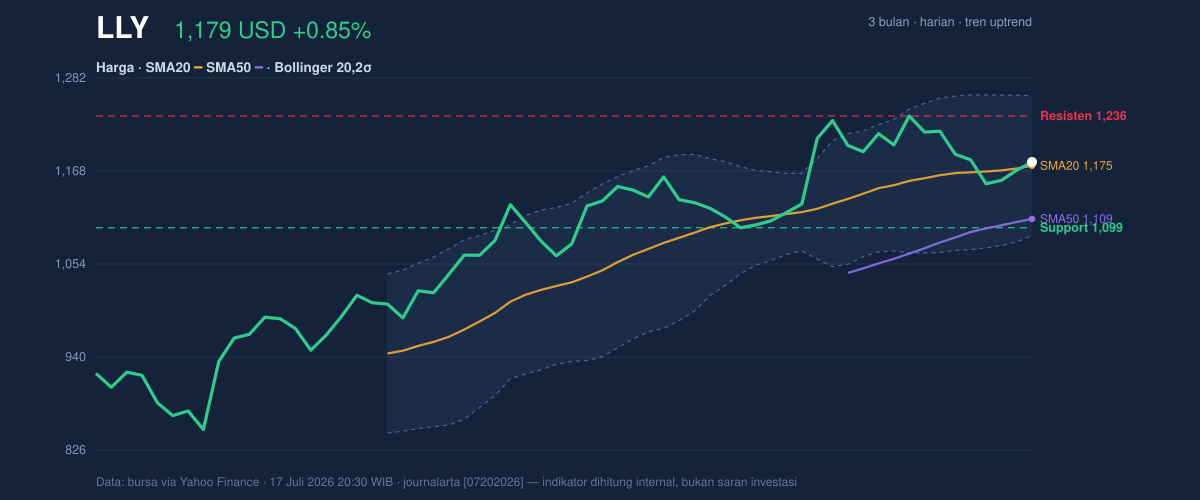
The structural picture remains firmly bullish. LLY trades above its 20-day simple moving average at 1,174.61, and that average itself is sloping upward at 0.78% per five days — a gentle but persistent climb rather than a vertical spike. The 50-day average sits far below at 1,109.42, meaning the stock holds a comfortable cushion over both of the trend lines that institutional investors watch most closely. There is no new moving-average crossover to report, which in plain terms means the bullish alignment — price above the fast average, fast average above the slow one — has been in place long enough to be considered established rather than fresh.
Context matters here. The three-month range runs from a low of 850.51 to a high of 1,249.45, a staggering swing that shows how violently sentiment on the GLP-1 weight-loss franchise has shifted. The current price sits at 59% of the narrower 20-day range — above the midpoint, but not pressing the ceiling. As shown in the chart, that is the posture of a stock consolidating gains, not one exhausting them.
Oscillators & Momentum
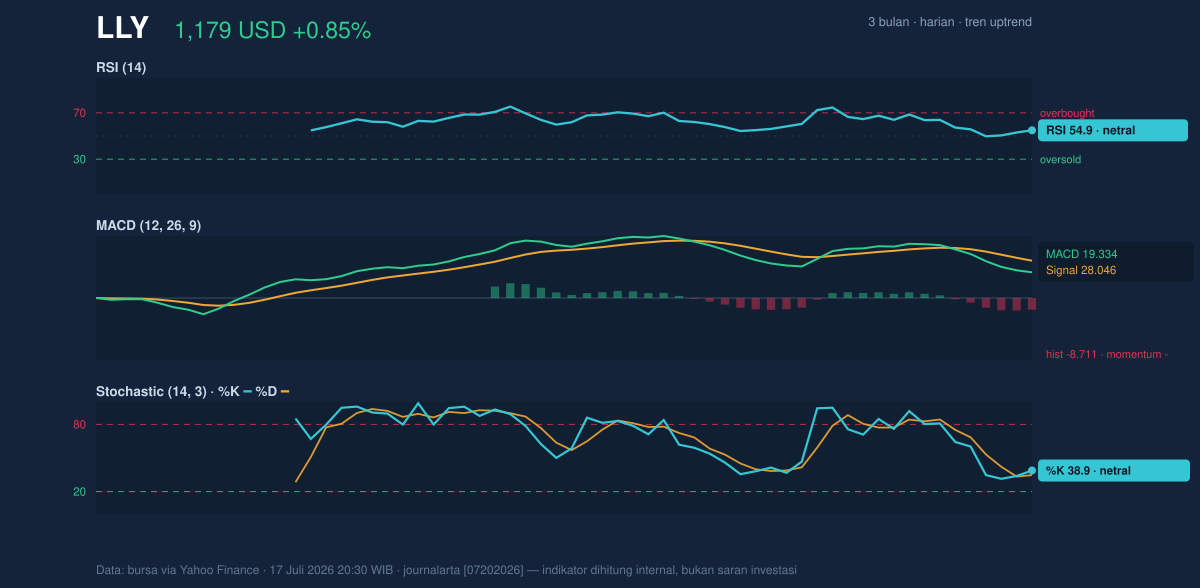
This is where the story gets more nuanced. The RSI at 54.9 is neutral — the 14-day Relative Strength Index, which measures the speed of recent gains versus losses on a 0–100 scale, flashes neither the overbought warning above 70 nor the oversold opportunity below 30. The Stochastic oscillator tells a similar tale, with %K at 38.9 crossing above %D at 34.7 in the lower-neutral zone — a small, early hint that short-term selling pressure is stabilizing.
The MACD, however, disagrees. The indicator — which tracks the gap between fast and slow exponential averages — reads 19.334 against a signal line of 28.046, leaving the histogram at -8.711, firmly negative. Translation: the medium-term trend is still up (MACD is above zero), but the most recent upward thrust is decelerating. As visible in the momentum chart, this is the classic footprint of a trend pausing to digest gains, not yet reversing — but not accelerating either.
Volatility & Volume
Bollinger Bands frame the calm. With the price at %B of 53% — essentially mid-band between the upper band at 1,260.27 and the lower at 1,088.94 — and band width at a normal 14.6%, there is no squeeze signalling an imminent explosion, and no expansion signalling panic. The Average True Range of 38.47, roughly 3.3% of the share price, confirms moderate daily volatility: wide enough to matter, calm enough to plan around.
Volume adds the quiet subplot. The last session's 2,756,400 shares ran at just 0.9× the 20-day average — participation is slightly thin. Yet On-Balance Volume, a running tally of buying versus selling pressure, is rising. That divergence — quiet tape, steady accumulation — suggests holders are not distributing into strength; buyers are simply patient rather than aggressive.
Key Levels & Scenarios
The ceiling is well defined: resistance at 1,235.56, backed by the three-month high at 1,249.45 and the upper Bollinger band at 1,260.27. A decisive break above that zone on expanding volume would confirm the uptrend's next leg. On the downside, the SMA20 at 1,174.61 is the first line of defence, followed by the SMA50 at 1,109.42 and support at 1,098.57, with the lower band at 1,088.94 beneath it. If the price fails to hold 1,174.61, expect a test of the 1,100 area; if 1,098.57 gives way, the entire short-term structure is damaged.
Technical Verdict: HOLD
The indicators argue for HOLD (wait & see) rather than fresh commitment at mid-range levels:
1. Trend intact — price above a rising SMA20 and far above the SMA50, with OBV confirming quiet accumulation.
2. Momentum unconfirmed — the MACD histogram at -8.711 shows deceleration, and volume at 0.9× average offers no breakout fuel.
3. Location is poor — at %B 53% and 59% of the range, the stock sits in no-man's land between support and resistance.
Verdict invalidated if the price falls below 1,098.57, which would also drag it under the SMA50 and break the bullish structure.
- Entry Range: 1,100–1,175 (the pullback zone between 20-day support at 1,098.57 and the SMA20 at 1,174.61); momentum-style entries would only activate on a confirmed break above 1,235.56
- Exit Target: 1,235.56 first, extended to 1,249.45–1,260.27 (the three-month high and upper Bollinger band)
- Stop Loss: below 1,098.57, under the 20-day support and near the lower band at 1,088.94
In plain English: Lilly's uptrend is alive but catching its breath — patience for either a dip toward support or a clean break of resistance beats chasing the middle of the range. This is technical analysis, not an investment recommendation; the site disclaimer applies.
Summary Data LLY
| Last price | 1,179.11 USD |
| Change 1 day / 5 days / 1 month | 0.85% / -0.80% / 6.04% |
| Trend / MA-cross | uptrend / none |
| SMA20 / SMA50 | 1,174.61 / 1,109.42 |
| RSI (14) / Stochastic %K | 54.9 / 38.9 |
| Bollinger %B / ATR | 53% / 38.47 |
| Support / Resistance 20 days | 1,098.57 / 1,235.56 |
| Data as of | 17 Juli 2026 20:30 WIB |


