Singtel Stock Technicals Today: Gains 1.14%, Testing Key Resistance
On Juli 20, 2026: price 4.44 SGD, trend sideways, RSI 52.4, support 4.35, resistance 4.47. technical analysis of singtel stock. Singtel Stock Technicals — full…

Singapore Telecommunications rose 1.14% to S$4.44 on the Singapore Exchange on 17 July, with exchange data via Yahoo Finance showing volume running at 1.3 times its 20-day average — a notable uptick in participation for a stock that has otherwise been drifting sideways for a month. The gain lifted Singtel above its short-term trend line, but the rally is now walking straight into a heavily defended ceiling. What the charts describe is less a breakout than a coiled spring.
Trend & Price Action
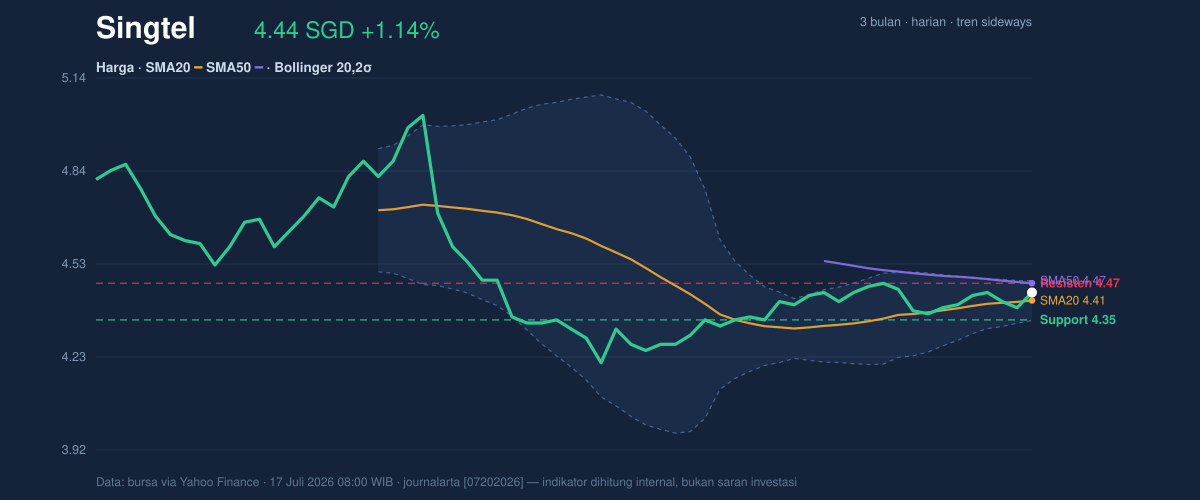
Singtel's trend is officially sideways: the 20-day simple moving average (SMA), a rough gauge of the average price paid over the past month, is sloping at just 0.58% per five days — nearly flat. The stock closed above that SMA20 at S$4.41, a mild positive, but remains below its 50-day average at S$4.47. No fresh crossover between the two averages has occurred, so there is no golden-cross or death-cross signal to act on; the intermediate trend is unresolved.
Zoom out and the picture gets more sobering. At S$4.44, Singtel sits in the lower third of its three-month range between S$4.15 and S$5.05. This is a stock rebuilding a base after a slide, not one in an established uptrend. Within the tighter 20-day range of S$4.35–4.47, however, price has climbed to the 75% mark — buyers currently have the short-term upper hand.
Oscillators & Momentum
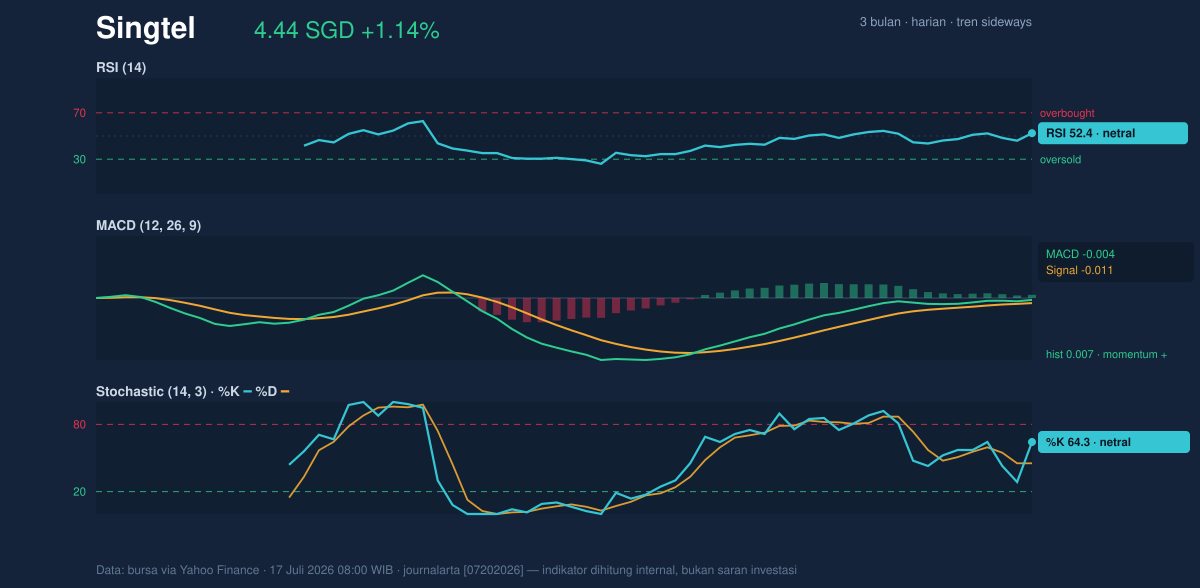
Momentum indicators lean gently bullish without flashing conviction. The 14-day Relative Strength Index (RSI), which measures the speed of recent gains versus losses on a 0–100 scale, reads 52.4 — dead neutral. Neither overbought nor oversold, it gives neither side an edge.
The more sensitive tools are more encouraging. The Stochastic oscillator shows %K at 64.3 crossing above %D at 45.2, a bullish crossover that typically signals building upside pressure. The MACD, which tracks the gap between two moving averages, sits at -0.004 versus its signal line at -0.011, producing a positive histogram of +0.007. The nuance matters: the MACD line itself remains below zero, meaning short-term momentum is improving inside a still-weak medium-term trend. That is recovery momentum, not trend momentum.
Volatility & Volume
The Bollinger Bands — volatility boundaries drawn two standard deviations around the 20-day average — have narrowed to a width of just 3.0%, a squeeze. Squeezes store energy: they historically precede sharp expansions in either direction, and the %B reading of 70% shows price already pressing toward the upper half of the bands. The Average True Range of S$0.07, about 1.6% of price, signals moderate daily volatility — so a one- or two-cent poke above resistance would be noise, not confirmation.
Volume adds the most interesting clue. Thursday's 32.8 million shares against a 26.2 million average, combined with a rising On-Balance Volume line (a running tally of volume on up-days minus down-days), points to quiet accumulation rather than distribution. Someone is buying the range.
Key Levels & Scenarios
The battleground is unusually well defined. Resistance clusters at S$4.47–4.48, where the 50-day average, the 20-day range top, and the upper Bollinger Band stack into a triple barrier. A decisive close above that zone on elevated volume would resolve the squeeze upward and eventually put the three-month high of S$5.05 back on the map. Failure there likely rotates the stock back toward S$4.35 — the 20-day support that overlaps the lower band. A close below S$4.35 would break the base and expose the three-month low at S$4.15.
Technical Verdict: HOLD
HOLD (wait & see) — the indicators argue for patience over positioning:
1. No trend edge: price is trapped between SMA20 (S$4.41) and SMA50 (S$4.47) with a flat slope — sideways markets punish early commitments.
2. Squeeze unresolved: the 3.0% Bollinger squeeze promises movement but does not yet say which way.
3. Bullish clues unconfirmed: positive MACD histogram, Stochastic crossover, 1.3× volume, and rising OBV all lean up — but none of it counts until the S$4.47–4.48 barrier breaks.
Verdict invalidated if price falls below S$4.35, which would flip the setup bearish.
- Entry range: S$4.35–4.41 on a pullback into support, or above S$4.48 only on a confirmed breakout close
- Exit target: S$4.47–4.48 as the first barrier; S$5.05 (three-month high) as the extended objective
- Stop loss protection: a close below S$4.35
In plain English: this is a "wait for the stock to show its hand" moment — strength is building but not proven, and the chart rewards patience. This is technical analysis, not an investment recommendation.
| Indicator | Reading | Signal |
|---|---|---|
| Last price | S$4.44 (+1.14%) | Above SMA20 |
| SMA20 / SMA50 | 4.41 / 4.47 | Sideways, no cross |
| RSI (14) | 52.4 | Neutral |
| MACD histogram | +0.007 | Positive momentum |
| Bollinger width | 3.0% | Squeeze |
| Volume vs avg | 1.3×, OBV rising | Accumulation |
| Support / Resistance | 4.35 / 4.47 | Range intact |
Summary Data Singtel
| Last price | 4.44 SGD |
| Change 1 day / 5 days / 1 month | 1.14% / 0.91% / 2.07% |
| Trend / MA-cross | sideways / none |
| SMA20 / SMA50 | 4.41 / 4.47 |
| RSI (14) / Stochastic %K | 52.4 / 64.3 |
| Bollinger %B / ATR | 70% / 0.07 |
| Support / Resistance 20 days | 4.35 / 4.47 |
| Data as of | 17 Juli 2026 08:00 WIB |

