UOB Momentum Gains: Stock Drops 2.37% (Juli 20, 2026)
On Juli 20, 2026: price 42.47 SGD, trend uptrend, RSI 57.7, support 39.46, resistance 44.95. technical analysis of uob stock. UOB Momentum Gains — full details…

United Overseas Bank shares fell 2.37% to 42.47 SGD on the Singapore Exchange in the latest session, according to exchange data via Yahoo Finance as of 17 July 2026 — a single-day drop that accounts for more than half of the stock's 4.30% decline over the past five days. The pullback lands after a strong month in which UOB gained 8.20%, leaving investors with a familiar question: is this a healthy pause in an advancing market, or the first crack in the trend? The technical evidence, read carefully, points to the former — with caveats.
Trend & Price Action
The underlying trend remains firmly upward. UOB trades above its 20-day simple moving average of 41.60 SGD, which itself is rising at a 2.91% clip over five days, and comfortably above the 50-day average at 39.43 SGD. No new moving-average crossover has formed, meaning the existing bullish alignment is undisturbed. The stock sits at 55% of its 20-day range and well off the three-month high of 45.15 SGD — a level that, together with the lower boundary of 35.70 SGD, frames just how far the recovery has travelled.
As shown in the chart, the price is retreating from the upper half of its Bollinger envelope toward the middle band. The %B reading of 61% confirms this: UOB is in the upper portion of its normal trading band, but no longer pressing against it.
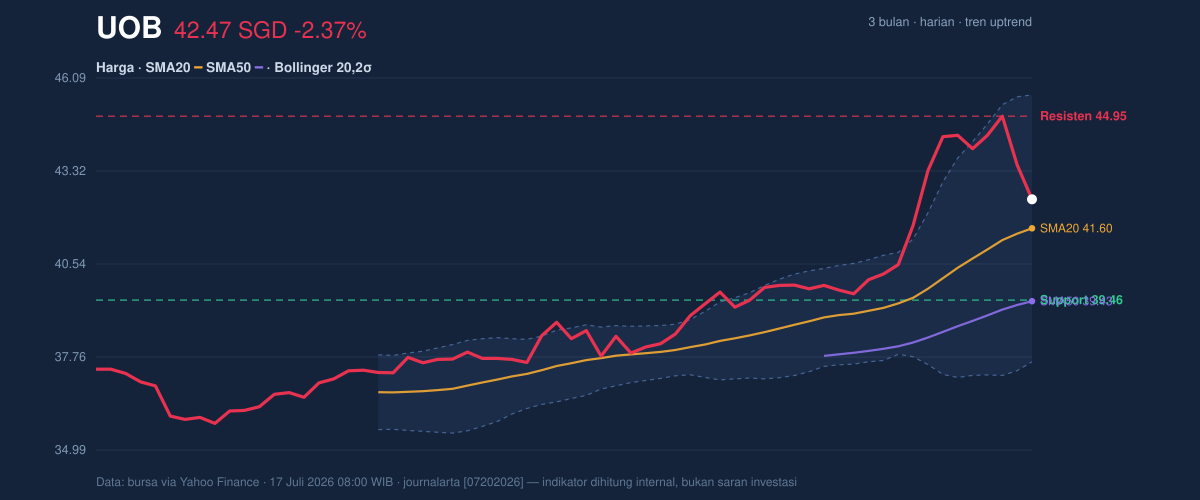
The Bollinger bands themselves — upper at 45.59, middle at 41.60, lower at 37.62 — are running at a width of 19.1%, which is normal. There is no squeeze signalling an imminent explosive move, and no extreme expansion signalling exhaustion.
Oscillators & Momentum
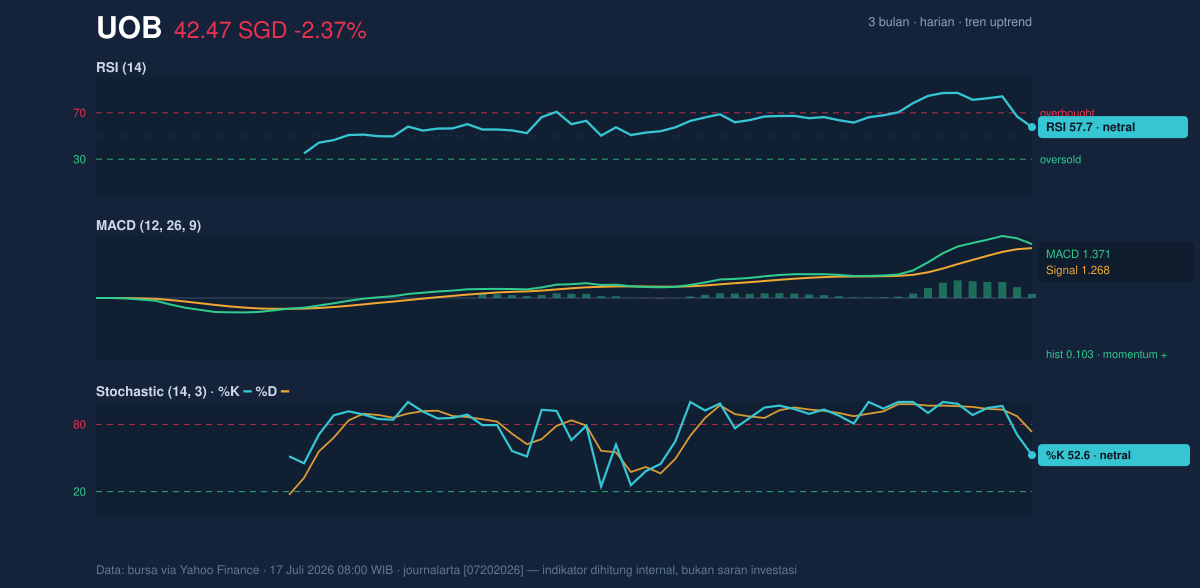
Momentum indicators tell a story of cooling, not collapsing. The RSI at 57.7 sits in neutral territory, having shed any overbought pressure built up during the monthly rally. That is typically what a trend needs to sustain itself — froth burned off without damage to structure.
The Stochastic oscillator, however, deserves attention. The %K line at 52.6 has slipped below the %D line at 73.3, a short-term bearish crossover inside neutral ground. It suggests the immediate impulse has faded and the path of least resistance, for now, is sideways-to-lower. The MACD offers the counterweight: at 1.371 it remains above its signal line of 1.268 with a positive histogram of 0.103, as the momentum chart illustrates — but that histogram is thin, indicating the bullish engine is idling rather than accelerating.
Volatility & Volume
The session's most striking feature was participation. Volume reached 5,766,300 shares, roughly 1.7 times the 20-day average of 3,362,120 — a genuine surge. Heavy volume on a down day is classically a warning of distribution, where large holders sell into strength. Yet the On-Balance Volume indicator is still rising, which means the cumulative flow of money into the stock has not reversed. One heavy down day against a rising OBV trend reads more like profit-taking than institutional exit.
Volatility context softens the alarm further. The Average True Range of 0.96 SGD equals about 2.3% of the share price, so the latest 2.37% decline represents roughly one average daily move. Statistically, it was a normal session in size — unusual only in its direction relative to the recent run.
Key Levels & Scenarios
The framework is clean. Support sits at 39.46 SGD, reinforced by the 50-day average at 39.43 — a confluence that makes the zone technically significant. Resistance stands at 44.95 SGD, just below the three-month high of 45.15 and the upper Bollinger band at 45.59.
If the price holds above the 20-day average at 41.60 and volume normalises, the pullback qualifies as a routine consolidation within the uptrend, and a retest of 44.95 becomes the base case. If 41.60 fails on another heavy-volume session, attention shifts to the 39.43–39.46 floor, where the medium-term trend itself would be put to a vote.
Technical Verdict: HOLD
The indicators argue for HOLD (wait & see) rather than action in either direction.
- The trend structure is intact: price above a rising SMA20 (41.60) and SMA50 (39.43), with MACD still in positive territory.
- The counter-signals are real but minor: a Stochastic bearish crossover (52.6 vs 73.3) and a 1.7× volume surge on a down day counsel patience over pursuit.
- RSI at 57.7 confirms no overbought excess — but also no oversold opportunity.
Verdict invalidated if the price falls below 39.43 SGD, where support and the 50-day average converge; a decisive break there would flip the structure bearish.
- Entry Range: 41.60 – 39.46 SGD (the SMA20-to-support pullback zone)
- Exit Target: 44.95 SGD (20-day resistance; stretch level 45.15)
- Stop Loss: below 39.43 SGD (SMA50)
In plain terms: the trend is still climbing, but the stock just had its heaviest down day of the month, so the data favours watching the 41.60 floor rather than committing fresh conviction. The next scheduled checkpoint is UOB's upcoming quarterly earnings disclosure, which will test whether the heavy volume was noise or forewarning.
*This is technical analysis based on market data, not an investment recommendation; the site's disclaimer applies.*
Summary Data UOB
| Last price | 42.47 SGD |
| Change 1 day / 5 days / 1 month | -2.37% / -4.30% / 8.20% |
| Trend / MA-cross | uptrend / none |
| SMA20 / SMA50 | 41.60 / 39.43 |
| RSI (14) / Stochastic %K | 57.7 / 52.6 |
| Bollinger %B / ATR | 61% / 0.96 |
| Support / Resistance 20 days | 39.46 / 44.95 |
| Data as of | 17 Juli 2026 08:00 WIB |


