CVX Stock Technicals Today: Gains 0.72%, Testing Key Resistance
On Juli 22, 2026: price 191.07 USD, trend sideways, RSI 67.8, support 165.69, resistance 191.07. technical analysis of cvx stock. CVX Stock Technicals — full…

Chevron Corp. rose to 191.07 USD on the NYSE, up 0.72% from the previous close, as the stock pressed against the top of its recent trading band, according to exchange data cited in Yahoo Finance. The move extends a 5-day gain of 5.12% and a 1-month advance of 9.15%, but the signal beneath the headline is more nuanced: Chevron is climbing inside a broadly sideways structure, not yet a clean breakout trend. The price is now sitting just below the upper Bollinger band, which means the shares are trading near the edge of their recent range rather than in open space.
Trend & Price Action
The chart shows Chevron above both its SMA20 at 176.30 and SMA50 at 182.12, a constructive setup because the shorter average is above the longer one and price is holding above both. That positioning usually tells traders that recent demand is strong enough to keep the stock above its medium-term trend line. Yet the report also shows no new MA-cross, so this is not a fresh trend reversal signal; it is more a continuation of an already-improving structure. The SMA20 slope of 1.35% over 5 days supports that reading, but the “sideways” trend label warns that the market is still digesting gains rather than launching into a decisive directional move.
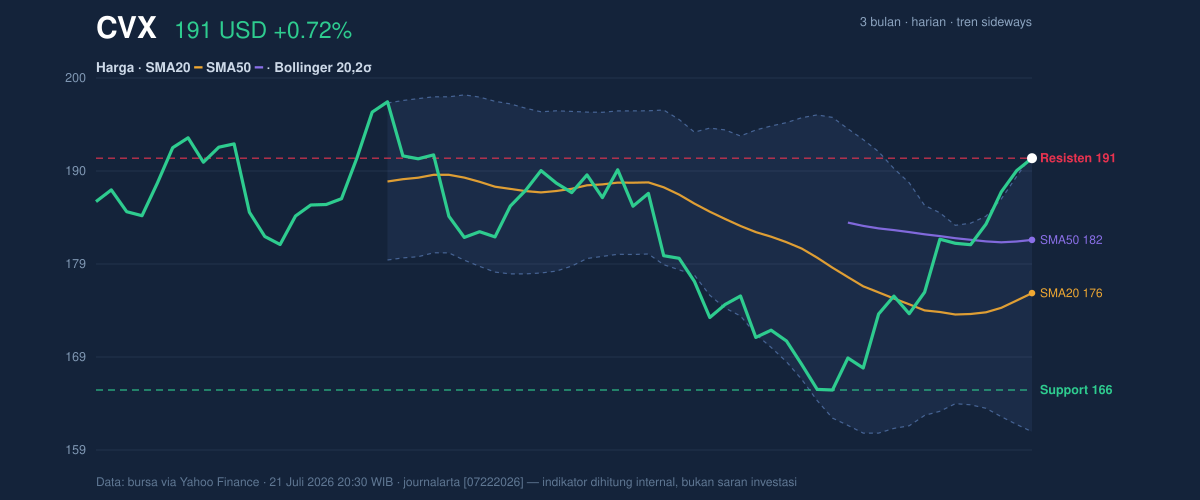
What matters here is where the price sits inside the range. Chevron is at 100% of the 20-day range, with 20-day resistance at 191.07 and 20-day support at 165.69. In plain terms, the stock has reached the ceiling of its recent corridor. That often attracts short-term profit-taking unless buyers can quickly absorb supply.
Oscillators & Momentum
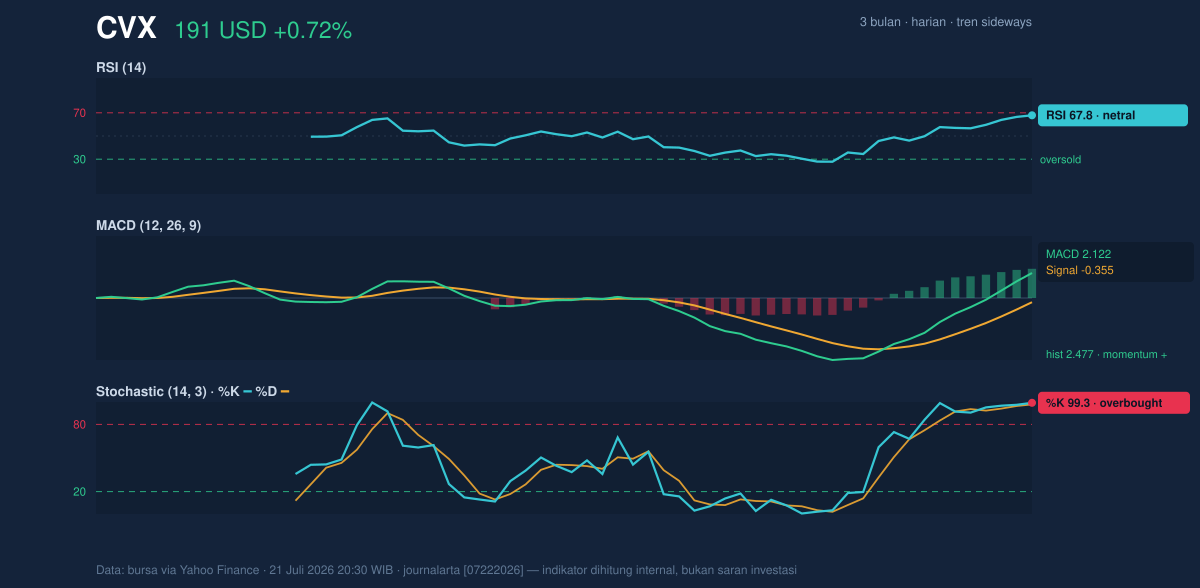
Momentum indicators are sending a split message. MACD at 2.122 with a signal line at -0.355 and a histogram of 2.477 points to positive momentum that is still expanding. For general readers, MACD compares short- and longer-term price movement; when it is positive and the histogram is wide, it means the stock is still accelerating upward rather than stalling. That aligns with the recent price gains.
But the oscillator cluster is also flashing caution. Stochastic %K at 99.3 and %D at 97.8 are deep in overbought territory, meaning the stock has risen so quickly that it may be vulnerable to a pause or pullback even if the broader trend remains intact. The RSI at 67.8 is labeled neutral in the data, but it sits close to the upper end of the typical range, reinforcing the idea that upside momentum is strong but stretched. In other words, the stock is not exhausted, but it is no longer cheap on a short-term momentum basis.
Volatility & Volume
Bollinger Bands help frame whether the move is routine or extended. Chevron’s upper band at 191.47 is almost touching the last price of 191.07, while %B at 99% shows the stock is hugging the top of the band. That usually means price is near the extreme of its recent volatility envelope. The good news is that the Bollinger width of 17.2% is described as normal, not squeezed, so the market is not waiting for a volatility explosion. The bad news is that when price is this close to the upper band, the next move often depends on whether buyers can sustain volume.
They have not done that yet.
Volume came in at 6,888,800, below the 20-day average of 8,829,795, or about 0.8× normal. That matters because a move toward resistance usually looks healthier when it is backed by above-average turnover. Here, the rally is being confirmed by OBV rising — a sign that cumulative trading pressure is still leaning upward — but the latest session itself was not especially forceful. ATR at 3.65, equal to 1.9% of price, suggests volatility is moderate: enough for meaningful daily swings, but not the kind of turbulence that would imply a disorderly breakout.
Key Levels & Scenarios
The key short-term map is straightforward. Resistance at 191.07 is the immediate test because price is already there. Above that, the chart’s next reference is the 3-month high at 198.87. On the downside, the first important cushion is the SMA20 at 176.30, followed by the SMA50 at 182.12 as a secondary trend support. The deeper range floor sits at the 3-month low of 164.78, close to the 20-day support at 165.69.
The signal structure is conditional: if Chevron can clear and hold above the current resistance zone with stronger participation, the chart opens room toward the 3-month high. If it fails to sustain above the upper band and slips back under the SMA20, the market would be telling us that the recent advance was a stretched move inside a still-sideways range. That would not be a collapse — but it would be a warning that momentum is cooling faster than price is advancing.
Technical Verdict: HOLD (wait & see)
HOLD (wait & see)
- MACD is positive and still expanding, which supports the recent upside move.
- Stochastic is overbought and price is pressing the upper Bollinger band, so short-term upside looks extended.
- Volume is below average, which weakens the case for a clean breakout above resistance.
Verdict invalidated if price breaks below 176.30.
- Ideal Entry Range: 176.30–182.12
- Exit Target: 191.47–198.87
- Stop Loss protection: 165.69
For non-traders: Chevron is strong, but it is also stretched, so the chart is asking for confirmation before the next leg higher.
Summary Data CVX
| Last price | 191.07 USD |
| Change 1 day / 5 days / 1 month | 0.72% / 5.12% / 9.15% |
| Trend / MA-cross | sideways / none |
| SMA20 / SMA50 | 176.30 / 182.12 |
| RSI (14) / Stochastic %K | 67.8 / 99.3 |
| Bollinger %B / ATR | 99% / 3.65 |
| Support / Resistance 20 days | 165.69 / 191.07 |
| Data as of | 21 Juli 2026 20:30 WIB |


