JPM Testing Key Resistance: Stock Gains 1.88% (Juli 22, 2026)
On Juli 22, 2026: price 345.23 USD, trend uptrend, RSI 62.6, support 327.33, resistance 346.91. technical analysis of jpm stock. JPM Testing Key Resistance —…

JPMorgan Chase traded at 345.23 dollars on 21 July 2026, up 1.88% on the day and sitting just below the upper edge of its recent range. That matters because the stock is not only rising; it is doing so while price remains above the short- and medium-term trend lines, a setup that often signals a market still willing to pay up for the name even as some momentum gauges start to cool.
Trend & Price Action
The shares are in an uptrend, with the SMA20 at 336.46 and the SMA50 at 319.47, while the latest price is clearly above both. In plain terms, that means the market has been rewarding JPMorgan over both the past month and the broader recent period, and the stock is still trading in the upper half of its visible structure. The SMA20 is rising at 1.12% over 5 days, which confirms that the near-term trend is not flat; it is still pointing higher.
There is no fresh moving-average crossover, so the chart is not flashing a new trend-change signal. Instead, the message is continuation: the stock has already established its bullish structure, and traders are now watching whether it can keep extending without losing support. As shown in the chart, price is also near the top of its recent band, with the 20-hour resistance at 346.91 and the 3-month high at 351.24. That places JPMorgan close to a zone where upside becomes harder to achieve without stronger participation.
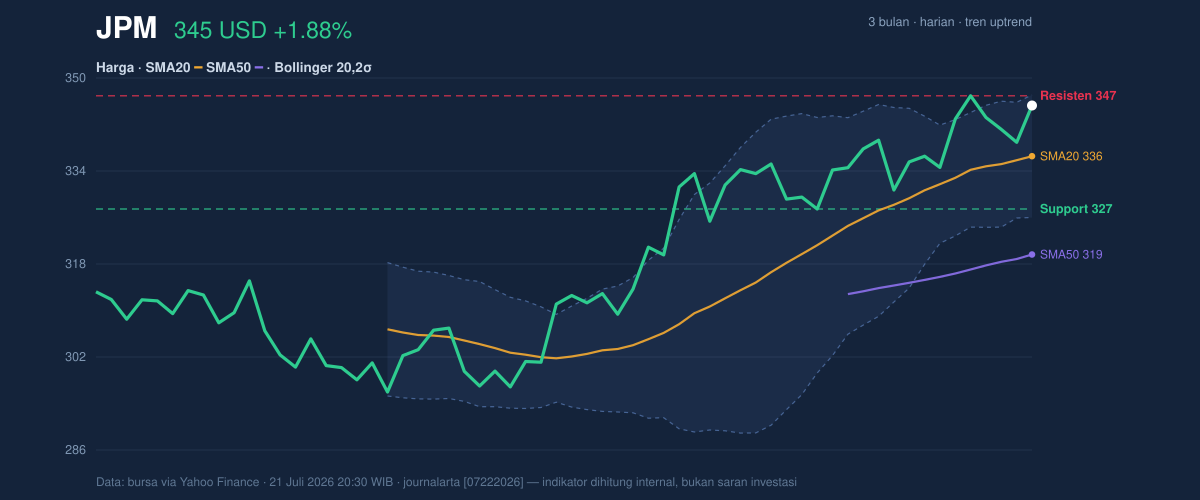
The 20-hour support at 327.33 is the key line beneath the market. If price holds above that area, the broader pattern remains intact. If it slips below it, the market would be telling investors that the recent advance is losing traction and that the current breakout attempt is fading back into the prior range.
Oscillators & Momentum
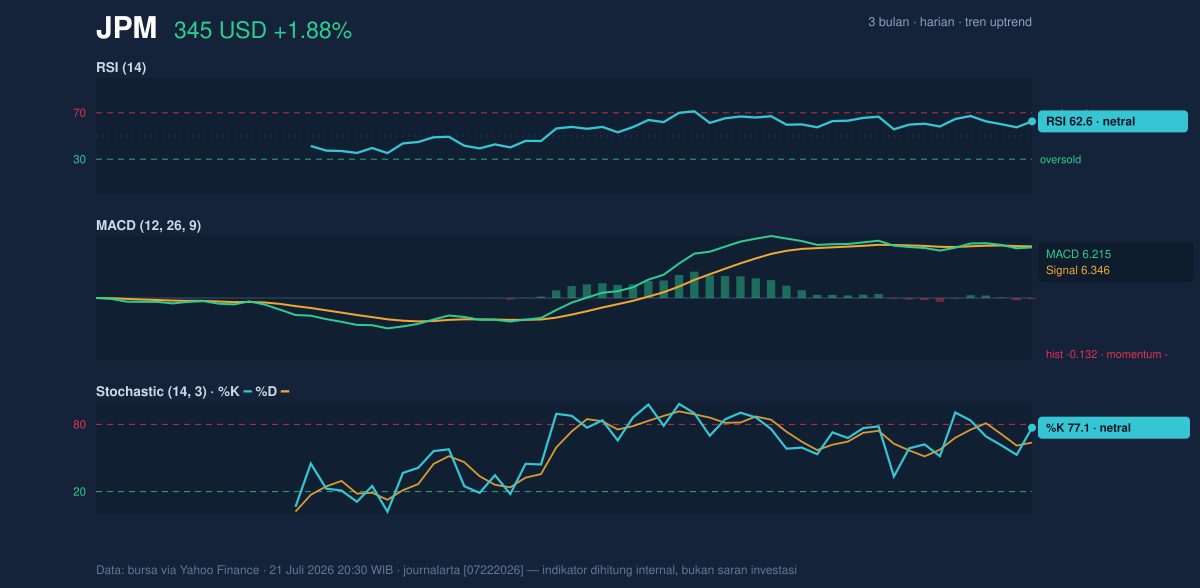
Momentum is more mixed than the trend. The RSI at 62.6 is still neutral, but it is close enough to the upper zone to show that the stock has been advancing with healthy demand. RSI in this area usually means strength without a full overbought condition; in other words, buyers are active, but the move is not yet stretched enough to force an immediate reversal signal.
The Stochastic %K at 77.1 and %D at 63.8 point to a market that is running near the upper end of its recent range. Stochastic tends to react faster than RSI, so this reading often means short-term enthusiasm is strong, but the stock may be closer to a pause than a fresh acceleration. That is especially relevant because the MACD at 6.215 sits below the signal line at 6.346, leaving a negative histogram of -0.132. This is the clearest caution flag in the data: the trend remains upward, but the pace of momentum has softened.
That combination matters. A stock can keep rising even while MACD weakens, but the signal usually means the move is becoming more mature. The chart is therefore showing a market that is still constructive on trend, yet not fully confirmed by momentum. In practical terms, JPMorgan is advancing, but the next leg higher will likely need stronger volume and a fresh turn in MACD to be convincing.
Volatility & Volume
The Bollinger Bands are tightening, with a 6.3% band width and the price at %B 91%. That means the stock is trading very near the top band at 347.06, a position that often reflects strong short-term pressure but also a higher chance of near-term hesitation. When bands narrow while price hugs the upper edge, the market is often coiling for a larger move; the direction of that move depends on whether buyers can keep control above resistance.
Volatility is moderate, not extreme. The ATR at 8.23, or 2.4% of price, suggests daily swings are meaningful but not disorderly. That gives the stock enough room to move without implying stress. The more important issue is participation: volume was 6,014,200, well below the 20-day average of 10,342,635, or 0.6× normal. That is a weak confirmation signal. Price is rising, but fewer shares are trading than usual, which can mean the move lacks broad conviction.
OBV, or on-balance volume, is also down. That is important because OBV is a cumulative measure of whether volume is backing price advances. A falling OBV while price is near highs suggests the rally is not yet being strongly validated by participation. In short, the stock is pressing against resistance without the volume profile that usually makes a breakout more reliable.
Key Levels & Scenarios
The immediate map is straightforward. Resistance at 346.91 is nearly aligned with the upper Bollinger band at 347.06, so JPMorgan is testing a tight cluster of overhead supply. A clean push above that zone would open the path toward the 3-month high at 351.24. If price cannot clear 346.91 and begins to fade, the first area to watch is the SMA20 at 336.46, which now acts as dynamic support.
The deeper floor is 327.33. That level matters because it sits below the moving-average structure and would signal that the recent advance has lost its near-term base. The current price is also at 91% of its 20-hour range, which means the stock is already near the upper end of its recent trading window. That position is bullish on its face, but it also leaves less room for error if momentum stalls.
Technical Verdict: HOLD (wait & see)
The technical picture is constructive, but not clean enough to call it fully confirmed. The uptrend is intact, price is above both SMA20 and SMA50, and the stock is pressing the upper Bollinger band. But MACD is negative, volume is only 0.6× average, and OBV is falling, which means the latest push higher is not yet backed by strong participation.
- Ideal entry range: 336.46 to 327.33, where the SMA20 and support zone can offer a clearer test of demand.
- Exit target: 347.06 to 351.24, using the upper Bollinger band and the 3-month high as the next resistance zone.
- Stop loss protection: below 327.33, because a break there would weaken the current trend structure.
- Verdict invalidated if price breaks below 327.33.
In plain English, JPMorgan looks strong, but the latest rise still needs stronger confirmation before the next move higher can be treated as durable. The stock’s nearest ceiling is 346.91.
Summary Data JPM
| Last price | 345.23 USD |
| Change 1 day / 5 days / 1 month | 1.88% / 0.68% / 4.15% |
| Trend / MA-cross | uptrend / none |
| SMA20 / SMA50 | 336.46 / 319.47 |
| RSI (14) / Stochastic %K | 62.6 / 77.1 |
| Bollinger %B / ATR | 91% / 8.23 |
| Support / Resistance 20 days | 327.33 / 346.91 |
| Data as of | 21 Juli 2026 20:30 WIB |

