Singtel Testing Key Resistance: Stock Gains 0.45% (Juli 22, 2026)
On Juli 22, 2026: price 4.42 SGD, trend sideways, RSI 49.8, support 4.37, resistance 4.47. technical analysis of singtel stock. Singtel Testing Key Resistance…

Singapore Telecom (Singtel) edged up to SGD 4.42 on the SGX in Singapore, a modest rise from the previous close of 4.40 that leaves the stock sitting almost exactly on its SMA20 at 4.42 and still below the SMA50 at 4.46. That positioning matters: it says the shares are not in a clean uptrend, but neither are they breaking down. The market is effectively pausing in the middle of the recent range, with the chart showing a stock that is trying to stabilise after a soft five-day patch, while the broader one-month move remains positive.
Trend & Price Action
The price structure is best described as sideways, and the key clue is the flat relationship between price and the short-term average. When a stock trades right on its 20-day moving average, it usually signals balance between buyers and sellers rather than conviction from either side. Here, the price is above the SMA20 but still below the SMA50, which means short-term sentiment has improved enough to hold the line, yet medium-term trend strength has not fully turned.
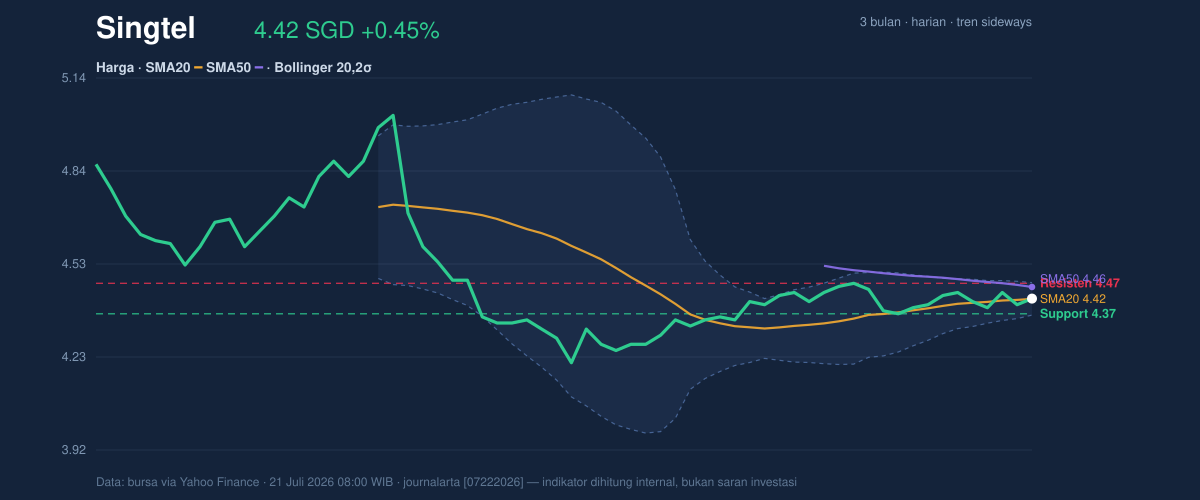
The moving averages also tell a restrained story. There is no new MA-cross, so the chart has not delivered the sort of clean trend signal that would suggest a fresh leg higher or a more decisive reversal lower. The SMA20 slope of 0.36% over 5 days is mildly positive, which is useful, but not strong enough to call momentum established. In plain language, the stock is leaning upward, not sprinting.
The range context is important too. The shares are trading around the midpoint of the 20-hour support at 4.37 and resistance at 4.47, which means the market has not yet chosen a direction. The broader 3-month range of 5.05 to 4.15 shows there is still room for recovery before the stock approaches its prior ceiling, but it also reminds readers that the recent floor has been tested lower than current levels.
Oscillators & Momentum
The momentum gauges are calm rather than emphatic. The RSI at 49.8 is neutral, which means the stock is neither overbought nor oversold. That is often what a stock looks like when it is waiting for a catalyst rather than pricing in one. The Stochastic %K at 50.0 and %D at 50.0 reinforces that message: price is sitting in the middle of its recent trading band, with no strong push from either direction.
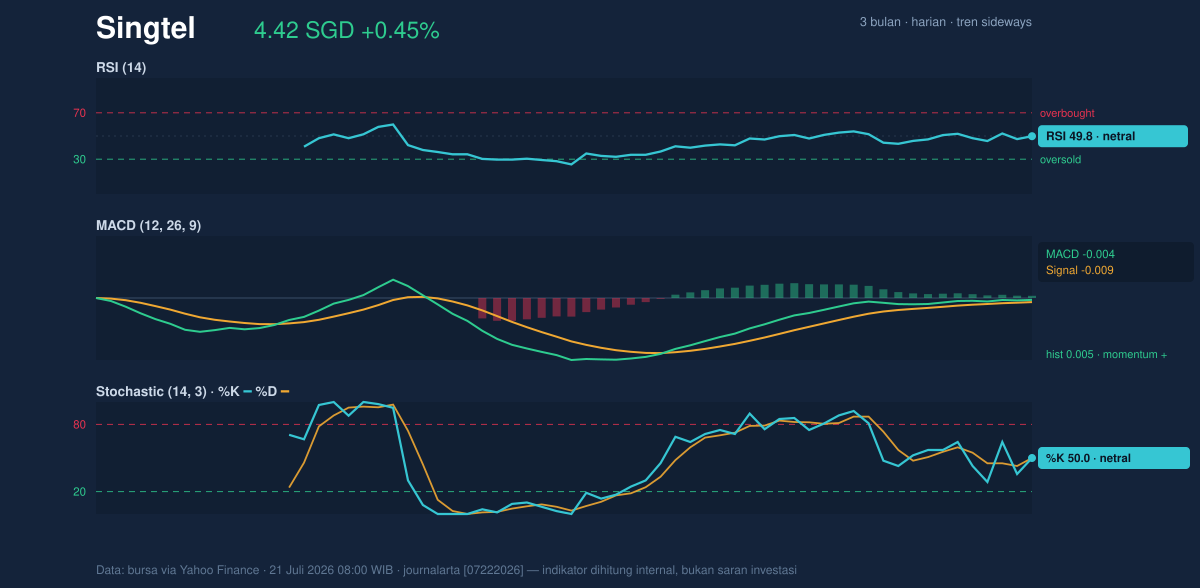
The more interesting signal comes from the moving-average convergence data. The MACD at -0.004 is slightly negative, but it sits above the signal line at -0.009, leaving the histogram at 0.005 in positive territory. That combination suggests momentum is improving even though it has not yet fully escaped neutral conditions. In practical terms, the stock is not showing strong upside acceleration, but the internal momentum is a little better than the headline MACD number alone would imply.
That distinction matters. A flat RSI with a mildly positive MACD often means a market is rebuilding rather than breaking out. It is a setup that can turn constructive if price confirms it, but it can also fade quickly if buyers fail to defend nearby support.
Volatility & Volume
Volatility is compressed. The Bollinger Band width of 2.4% is narrow, and the chart shows a squeeze, which usually means the stock is storing energy for a larger move. The middle band sits at 4.42, exactly where price is trading, while the upper band at 4.47 and lower band at 4.37 frame the immediate battleground. A squeeze does not predict direction on its own, but it does raise the odds of a sharper move once price leaves the band cluster.
The volume side is more supportive than the price action alone suggests. Last volume came in at 37,180,200, or 1.4x normal versus the 20-hour average of 26,932,900. That is a sign of participation, not indifference. When higher-than-average volume appears during a sideways phase, it often means institutions or larger holders are active, even if the chart has not yet resolved. The OBV is rising, which adds weight to the idea that accumulation is gradually outweighing distribution.
ATR also helps frame expectations. The ATR(14) of 0.07, equal to 1.6% of price, points to moderate day-to-day movement. So while the Bollinger squeeze suggests a pending expansion, the ATR says the stock has not yet entered a highly volatile regime. The likely result is a measured move first, not a disorderly one.
Key Levels & Scenarios
The chart’s immediate decision points are clear. 4.37 is the near-term support that matters most, because a break below it would push price out of the lower Bollinger band and weaken the current stabilisation pattern. On the upside, 4.47 is the first resistance to watch; a move through it would clear the upper band and signal that the squeeze is resolving to the upside.
The way the stock is positioned at 50% of the range makes the next move especially important. If price can hold above 4.42 and then reclaim 4.47, the market would be showing that the neutral oscillators are being converted into upward follow-through. If instead it slips under 4.37, the recent volume support would matter less, and the chart would start to look like a failed base rather than a pause.
Technical Verdict: HOLD (wait & see)
HOLD (wait & see)
- RSI at 49.8 and Stochastic at 50.0/50.0 are neutral, so momentum is not strong enough to confirm a directional break.
- MACD is slightly positive with a 0.005 histogram, which is constructive, but it still needs price confirmation.
- Bollinger Bands are squeezing around 4.42, while price remains between 4.37 support and 4.47 resistance, so the chart is compressed but unresolved.
- Invalidation: the verdict is invalidated if price falls below 4.37, because that would break near-term support and weaken the current base.
- Ideal Entry Range: 4.37 to 4.42
- Exit Target: 4.47
- Stop Loss protection: below 4.37
For non-traders, this means Singtel’s chart is stable but undecided, with evidence building for a move that has not yet shown its hand.
The latest 20-hour resistance remains 4.47.
Summary Data Singtel
| Last price | 4.42 SGD |
| Change 1 day / 5 days / 1 month | 0.45% / -0.45% / 1.61% |
| Trend / MA-cross | sideways / none |
| SMA20 / SMA50 | 4.42 / 4.46 |
| RSI (14) / Stochastic %K | 49.8 / 50.0 |
| Bollinger %B / ATR | 51% / 0.07 |
| Support / Resistance 20 days | 4.37 / 4.47 |
| Data as of | 21 Juli 2026 08:00 WIB |


