Testing Key Resistance, Alibaba Stock Gains 3.91% Today
On Juli 22, 2026: price 117.00 HKD, trend sideways, RSI 60.7, support 89.50, resistance 116.90. technical analysis of alibaba stock. Testing Key Resistance —…

Alibaba Group’s Hong Kong-listed shares rose to HK$117.00 on 20 July 2026, extending a short-term advance that pushed the stock above its 20-day average of HK$102.94 and just beyond the nearest 20-hour resistance at HK$116.90, according to data via Yahoo Finance. The move matters because it shows buyers have been willing to pay up even as the chart moves into a more crowded part of the range: the stock is now sitting at 100% of its recent range, which often means momentum is strong but room for easy gains is thinner.
Trend & Price Action
The broader pattern is still described as sideways, but the slope of the SMA20 is up 1.59% over 5 days, which signals that the short-term trend has improved even if the stock has not yet broken into a clean directional move. In practical terms, a sideways label with a rising short average usually means the market is transitioning from consolidation to a possible attempt at a higher trading band. Alibaba is also trading above the SMA20 and above the SMA50 at HK$115.49, a constructive alignment that suggests recent buying has been strong enough to reclaim the medium-term line.
The lack of a new MA-cross is important. A moving-average cross is often watched as a cleaner trend signal, and without one, the chart is not yet confirming a fully established breakout trend. Still, the fact that price is above both key averages means the burden has shifted to sellers to prove the move is only a short-lived spike.
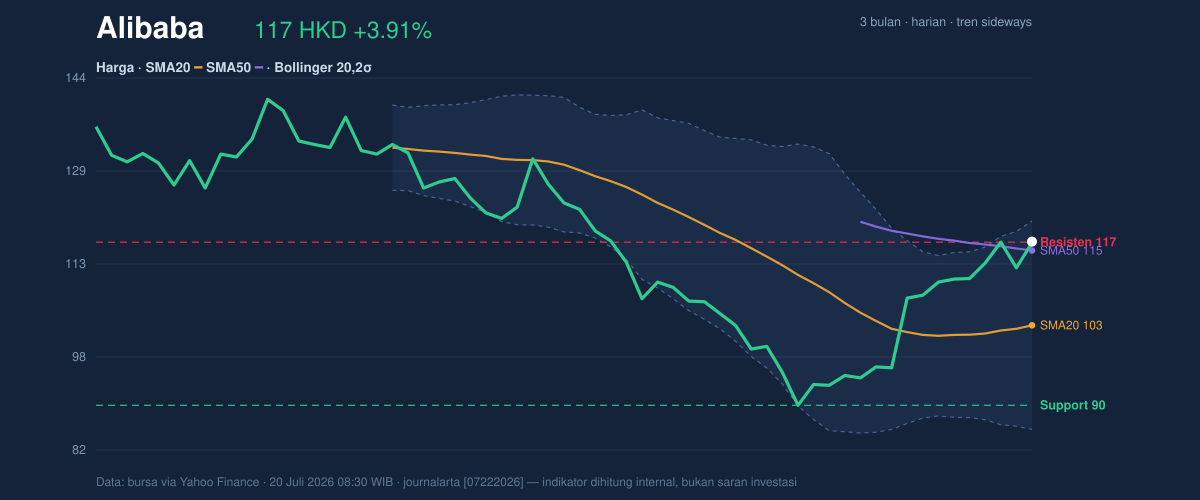
The price is also trading close to the upper Bollinger band at HK$120.45, which shows the shares are pressing the top end of their statistically expected range. That is bullish in the sense that the stock is stretching upward, but it also means the rally is less “quiet accumulation” and more “momentum test.” When a stock hugs the upper band while the band itself is widening, it usually tells traders that volatility is expanding and the market is preparing for a larger move in either direction.
A strong push, but not yet a clean escape.
Oscillators & Momentum
Momentum indicators are mixed in a way that often appears near short-term turning points. The RSI at 60.7 is still neutral, which means the stock is not yet in a classic overbought danger zone. That said, it is drifting high enough to show the rally has real force. The more cautionary signal comes from the Stochastic reading of %K 89.5 and %D 85.0, which is overbought. Stochastic measures where price sits within its recent range, so readings this elevated usually indicate the stock is closing near recent highs and may be vulnerable to pauses or pullbacks if fresh demand slows.
The MACD is positive at 0.697, with the signal line at -2.140 and a histogram of 2.838. That combination is a firm momentum confirmation: MACD above signal and a positive histogram mean upward force is still building rather than fading. In plain language, the trend-following indicator says the rally has not yet run out of fuel, even if the faster oscillator is warning that the move is getting stretched.
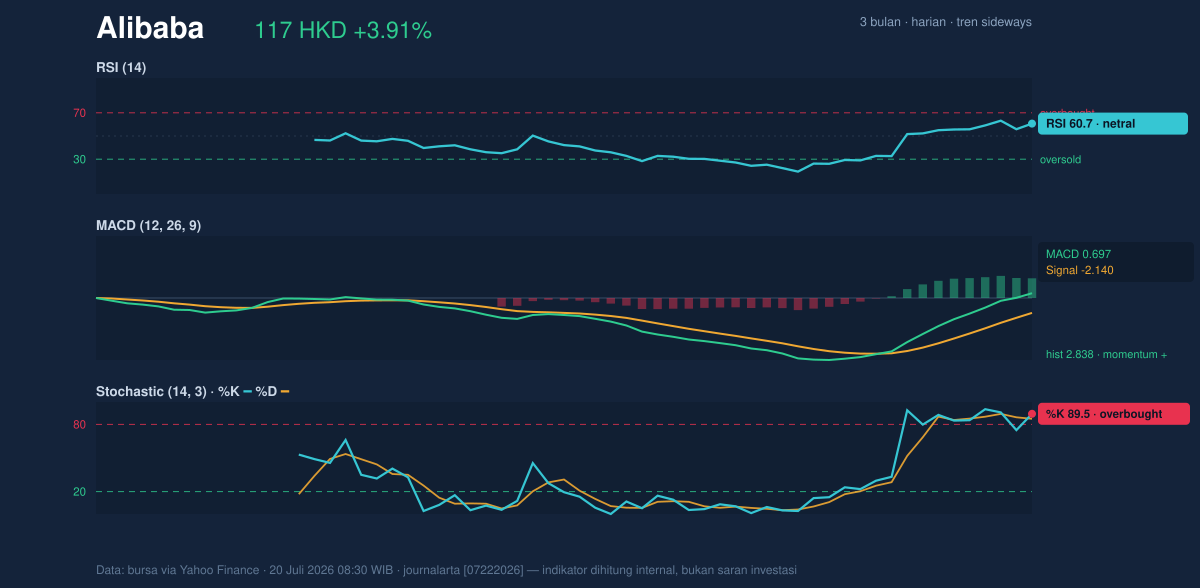
This is the key tension in the chart: trend and MACD are supportive, while stochastic is flashing that the stock is near a short-term hot zone. That combination often leads to either a brief consolidation before another leg higher or a sharp snapback if buyers hesitate.
Volatility & Volume
Volatility is elevated. The ATR(14) at 5.69, equal to 4.9% of price, means Alibaba is capable of making relatively wide daily moves. ATR is a measure of average true range, so a high reading like this tells readers that stop-loss distances and intraday swings are both likely to be larger than in a calmer market. The Bollinger band width of 34.0% is also expanding, which reinforces the message that the stock is not sitting in a low-volatility coil; it is already in an active phase.
Volume adds some confirmation. The latest turnover of 125,351,835 shares is roughly 1.0x normal versus the 20-hour average of 124,082,996, so the rally is not happening on a dramatic surge in participation, but neither is it being rejected by thin trading. More importantly, OBV is rising, which suggests volume has been supporting the advance over time. OBV, or on-balance volume, tracks whether volume is flowing into up days or down days; a rising line usually means accumulation is outpacing distribution.
That matters when price is near resistance. It says the move has backing, even if it is not explosive.
Key Levels & Scenarios
The nearest technical battleground is clear. The stock sits just above resistance at HK$116.90, and the next visible ceiling is the Bollinger upper band at HK$120.45. On the downside, the most important structural floor from the data is support at HK$89.50, with the SMA20 at HK$102.94 now acting as an intermediate trend marker. The 3-month high is HK$144.00 and the 3-month low is HK$88.65, which frames the broader range: the stock is trading in the upper half of that band, but still well below the peak.
If price can hold above HK$116.90, the chart suggests room for a test of HK$120.45, where the upper Bollinger band may act as the first real check on the rally. If the shares slip back below HK$115.49 and then the HK$102.94 area, the message would shift from breakout attempt to failed momentum recovery. A deeper break toward HK$89.50 would imply the recent advance has lost its structural base.
Technical Verdict: HOLD (wait & see)
HOLD (wait & see) is the clearest technical reading because the chart is constructive, but not yet clean enough to remove all doubt.
- MACD is positive and the histogram is 2.838, showing momentum is still expanding.
- Price is above the SMA20 and SMA50, which supports the short-term recovery.
- Stochastic is overbought and price is already near the upper Bollinger band at HK$120.45, so upside may need a pause first.
Verdict invalidated if price falls below HK$102.94, because that would mean the stock has lost its short-term average and the recent recovery is no longer holding.
- Ideal Entry Range: HK$102.94 to HK$115.49
- Exit Target: HK$120.45
- Stop Loss Protection: below HK$89.50
For non-traders: the chart still looks healthy, but it is close enough to resistance that patience matters more than chasing the move. Alibaba’s latest share price was HK$117.00 on 20 July 2026.
Summary Data Alibaba
| Last price | 117.00 HKD |
| Change 1 day / 5 days / 1 month | 3.91% / 5.69% / 11.53% |
| Trend / MA-cross | sideways / none |
| SMA20 / SMA50 | 102.94 / 115.49 |
| RSI (14) / Stochastic %K | 60.7 / 89.5 |
| Bollinger %B / ATR | 90% / 5.69 |
| Support / Resistance 20 days | 89.50 / 116.90 |
| Data as of | 20 Juli 2026 08:30 WIB |


