Testing Key Resistance, BP Stock Gains 2.36% Today
On Juli 22, 2026: price 529.30 GBp, trend sideways, RSI 59.8, support 455.60, resistance 521.90. technical analysis of bp stock. Testing Key Resistance — full…

BP plc’s London-listed shares closed at 529.30 GBp, up 2.36% on the day and extending gains to 4.81% over five days and 5.82% over one month, according to data from the exchange via Yahoo Finance at 20 July 2026 14:00 WIB. The move matters because it shows buyers are still in control, yet the stock is now trading above a level that often marks the edge of a short-term range rather than its centre.
Trend & Price Action
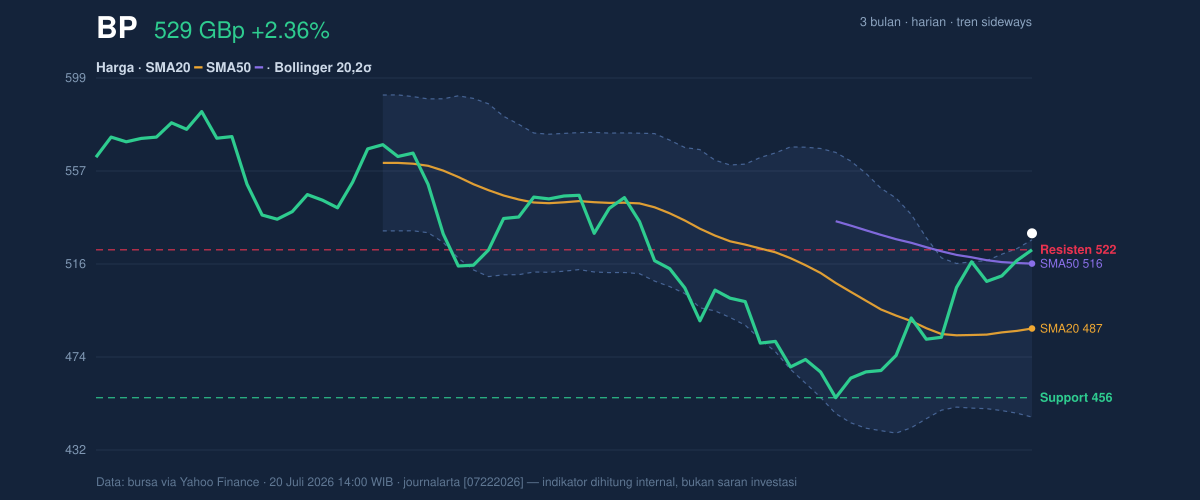
The broader structure is still described as sideways, but the price is leaning higher within that range. BP is trading above the SMA20 at 486.62 and also above the SMA50 at 515.71, which tells the market that recent strength has been enough to reclaim both the short-term and medium-term trend gauges. There is no fresh MA-cross, so this is not a new moving-average trend signal; instead, it is a continuation move inside an existing range.
The chart also shows the shares are sitting at 111% of the 20-day range, with the latest price above the listed 20-hour resistance at 521.90. That matters because resistance is where sellers have recently been willing to emerge. When price moves through that area and holds, it can indicate that supply is being absorbed. But when it moves too far beyond the range in a short period, it can also mean the market is running ahead of itself.
The upper Bollinger band is at 526.35, and BP is now trading above it. As shown in the chart, that places the shares in a statistically extended zone: not a reversal signal on its own, but a warning that the latest leg higher may need consolidation before it can continue cleanly. The Bollinger band width is 16.3%, described as normal, so this is not a squeeze setup where a sharp breakout is being forced by compressed volatility. It is a more ordinary expansion phase, with price pressing the top of the envelope.
Oscillators & Momentum
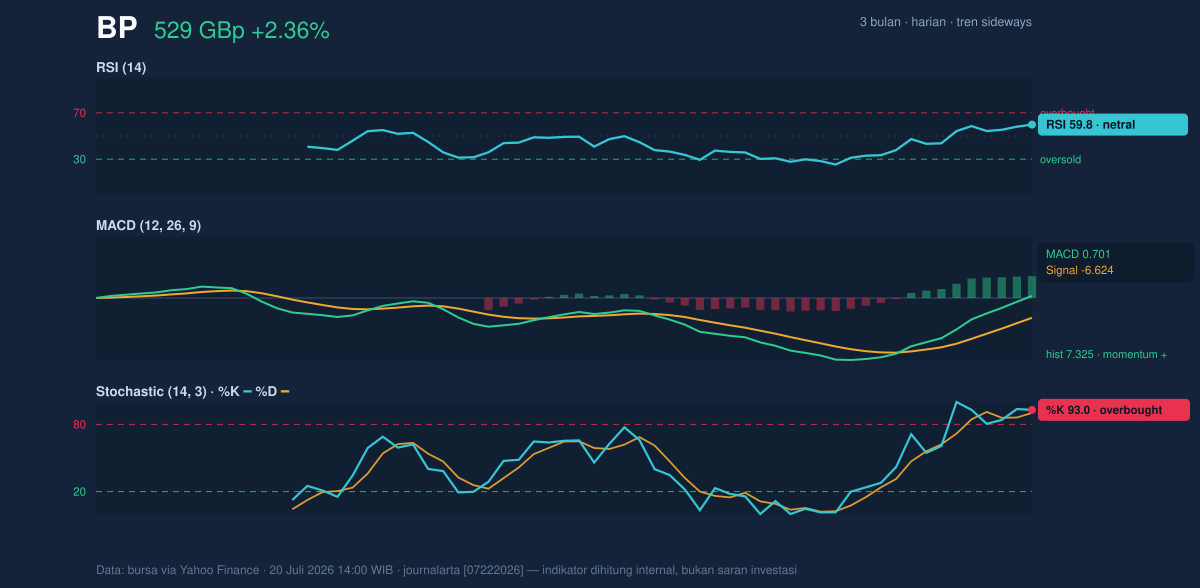
The momentum picture is mixed in a way that often appears near short-term peaks. The RSI at 59.8 is still neutral, which suggests the stock is not yet in a deeply overbought condition on that measure. But the Stochastic at 93.0 / 90.3 is overbought, and that is important because stochastic tends to react faster than RSI. In plain terms, it shows BP has been closing near the top of its recent range for long enough that the rally may be running hot.
At the same time, the MACD is positive at 0.701, with the signal line at -6.624 and the histogram at 7.325. That combination points to rising upward momentum and confirms that the latest advance is not just a one-day spike. The signal is strongest when MACD and price trend agree, and here they do: price is above both moving averages, volume is slightly above normal, and OBV is rising, which suggests participation has been broad enough to support the move.
Still, the tension between a positive MACD and an overbought stochastic is a classic short-term caution flag. It usually means the trend is intact, but the next move may be more likely to pause, drift, or retest nearby support before extending further.
Volatility & Volume
Volatility is not especially elevated by BP’s recent standards. The ATR at 12.79, equal to 2.4% of price, indicates a moderate daily swing range. That is enough for meaningful movement, but not enough to suggest disorderly trading. In practical terms, the stock can still move decisively, yet it is not flashing the kind of extreme volatility that usually accompanies major event risk.
Volume supports the move without turning it into a blow-off rally. Last trade volume was 41,248,602, about 1.1× normal versus the 20-day average of 39,076,968. That is a modest confirmation rather than a surge. The more constructive detail is that OBV is rising, which means volume has recently been accumulating in the direction of the price advance. For technicians, that is often more meaningful than a single day’s turnover because it suggests money is flowing into the stock rather than just chasing a headline.
The message from volatility and volume together is straightforward: the rally has enough backing to be credible, but it is not yet so forceful that it overrides the overbought warning from stochastic readings.
Key Levels & Scenarios
BP’s nearest downside reference is the 20-day SMA at 486.62, which also matches the middle Bollinger band. That level is important because it represents the centre of the recent trading structure. A move back toward it would not automatically damage the trend, but a sustained break below it would suggest the stock is losing its short-term momentum and reverting toward the middle of the range.
Below that, the chart shows support at 455.60. That level sits only modestly above the 3-month low at 450.60, so a failure there would expose the lower end of the broader range and would imply the recent breakout has not held. On the upside, the immediate reference is resistance at 521.90, with the upper Bollinger band at 526.35 now acting as the next technical ceiling. Because price is already above both, the question is not whether they can be touched, but whether the market can remain above them without fading back inside the range.
As shown in the chart, the stock is trading well below the 3-month high at 592.00, so there is still room within the wider band if momentum persists. But the current setup is more about whether the breakout can be retained than whether a new trend has already been confirmed.
Technical Verdict: HOLD (wait & see)
HOLD (wait & see) because the trend is constructive, but the stock is now stretched above the upper Bollinger band and the stochastic oscillator is overbought.
- Reason 1: MACD is positive and the histogram is strong, confirming upward momentum.
- Reason 2: Price is above SMA20 and SMA50, which keeps the short-term structure bullish.
- Reason 3: Stochastic is overbought and price is above the upper Bollinger band, warning that the move may need to cool.
Verdict invalidated if price falls below 486.62, because that would mean BP has lost the middle Bollinger/SMA20 support that currently anchors the move.
- Ideal Entry Range: 486.62 to 521.90
- Exit Target: 526.35, with the wider chart reference at 592.00
- Stop Loss protection: 455.60
For non-traders, this means BP still looks firm, but the share price is running hot enough that the next move may be a pause rather than a straight line higher.
Next scheduled technical checkpoint: the market will be watching whether BP can hold above 521.90 and 526.35 on the next sessions, or slip back toward 486.62.
Summary Data BP
| Last price | 529.30 GBp |
| Change 1 day / 5 days / 1 month | 2.36% / 4.81% / 5.82% |
| Trend / MA-cross | sideways / none |
| SMA20 / SMA50 | 486.62 / 515.71 |
| RSI (14) / Stochastic %K | 59.8 / 93.0 |
| Bollinger %B / ATR | 104% / 12.79 |
| Support / Resistance 20 days | 455.60 / 521.90 |
| Data as of | 20 Juli 2026 14:00 WIB |


