Alibaba Stock Technicals Today: Drops 2.74%, Momentum Gains
On Juli 23, 2026: price 113.60 HKD, trend sideways, RSI 61.1, support 89.50, resistance 117.00. technical analysis of alibaba stock. Alibaba Stock Technicals —…

Alibaba Group’s Hong Kong-listed shares on HKEX fell to HKD 113.60 as of 21 July 2026 08:30 WIB, down 2.74% from the previous close, even as the stock still holds a 10.40% gain over one month, according to exchange data via Yahoo Finance. The move leaves the name in a technically awkward middle ground: the price remains above its short-term average, but it is also sitting below the medium-term average, with momentum indicators sending mixed messages that matter more than the headline decline itself.
Trend & Price Action
The chart shows Alibaba in a sideways trend, not a clean uptrend or downtrend, which is important because sideways structures often act like pressure cookers: they compress risk until price chooses a direction. The share price is above the SMA20 at HKD 103.65 but below the SMA50 at HKD 115.02, a setup that says short-term buyers have improved the floor, yet medium-term trend followers have not fully regained control. There is no fresh MA cross, so the market has not produced the cleaner signal that would usually confirm a trend handover.
That matters because price is now trading near the upper half of its recent range, at 88% of the 20-session range, with the 20-session resistance at HKD 117.00 just overhead and the 20-session support at HKD 89.50 much lower down. The stock is also still well below the 3-month high of HKD 144.00, but comfortably above the 3-month low of HKD 88.65, which reinforces the idea that this is a recovery phase rather than a breakout phase.
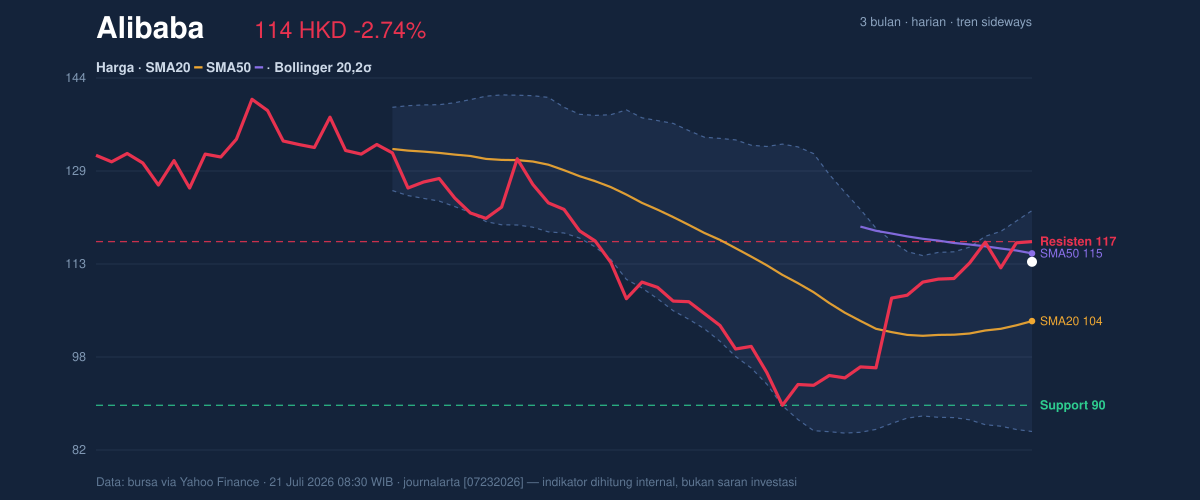
The key signal here is not that Alibaba is weak; it is that the market is still deciding whether recent strength can survive the overhead supply around the HKD 115.02 to HKD 117.00 zone.
Oscillators & Momentum
The momentum picture is more constructive than the price structure alone suggests. The RSI at 61.1 is still neutral, which means the stock is not yet in a classic overheated condition on this measure. But the Stochastic %K at 86.0 and %D at 83.4 are both overbought, a sign that the recent advance has moved fast enough to stretch short-term conditions. In plain language, buyers have been active, but they may now be running ahead of themselves.
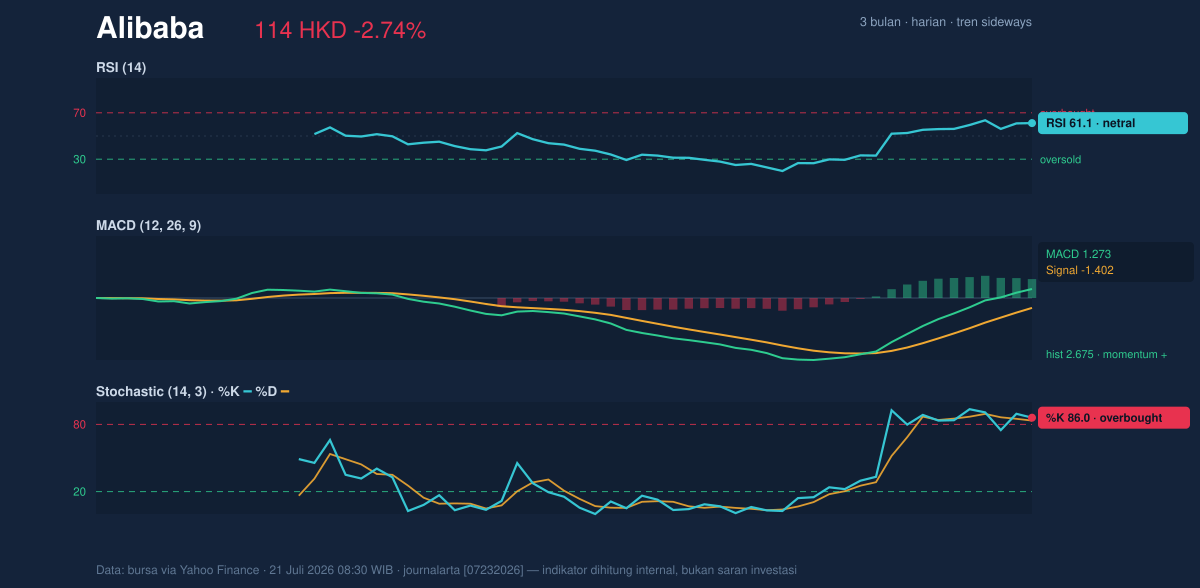
The more important confirmation comes from the MACD at 1.273, which sits above the signal line at -1.402 and leaves a positive histogram of 2.675. That combination shows momentum is still positive even though the stock has pulled back on the day. In technical terms, MACD is describing the underlying thrust of the move, while Stochastic is warning that the move may be temporarily stretched. Those two signals do not cancel each other out; they tell you the trend has energy, but near-term upside may need consolidation before it can extend cleanly.
Volatility & Volume
Volatility has clearly expanded. The Bollinger Bands are wide, with the upper band at HKD 122.20, the middle band at HKD 103.65, and the lower band at HKD 85.10. A 35.8% band width and a %B of 77% indicate price is leaning toward the upper half of the band structure, but not yet pressing the top band. That usually means the market is not in panic mode; it is in an active range where decisive breaks can travel quickly if they happen.
The ATR(14) at 5.89, equal to 5.2% of price, confirms that daily swings are still elevated. This is a critical clue for readers: when ATR is high, even ordinary moves can look dramatic, and stops or thresholds need to account for that wider daily noise. Volume adds a nuance. The latest turnover of 98,262,426 shares is only 0.8x the 20-session average of 124,035,402, so the latest decline did not come with especially heavy participation. Yet OBV is rising, which suggests that, over time, buying pressure has outweighed selling pressure even if the most recent session was softer.
In other words, the pullback is not being backed by a clear surge in distribution.
Key Levels & Scenarios
The immediate technical battleground is tight. The stock is sitting just under HKD 115.02, with HKD 117.00 as the nearby resistance ceiling from the 20-session range. If Alibaba can reclaim and hold above that zone, the chart would begin to look less like a range and more like an attempt to challenge the upper Bollinger band at HKD 122.20. If it fails there, the market is more likely to drift back toward the HKD 103.65 mid-band and SMA20 area, which is the first meaningful support cluster.
The broader downside reference remains the HKD 89.50 support, with the HKD 88.65 three-month low close by. A move into that area would signal the recent recovery has lost momentum and that the stock is revisiting the lower end of its established range.
Technical Verdict: HOLD (wait & see)
HOLD (wait & see) fits best because the chart is not weak enough to turn defensive, but not strong enough to confirm a fresh bullish breakout.
- MACD is positive, which supports the idea that underlying momentum remains constructive.
- Price is above the SMA20, showing short-term recovery is intact.
- Stochastic is overbought and price is still below the SMA50, which limits conviction near current levels.
Verdict invalidated if price breaks below HKD 103.65, because that would mean the stock has lost the SMA20 and the Bollinger middle band, weakening the short-term structure.
- Ideal Entry Range: HKD 103.65 to HKD 109.00
- Exit Target: HKD 117.00 to HKD 122.20
- Stop Loss Protection: below HKD 89.50
For non-traders: Alibaba is not flashing a clean breakout signal yet, but the trend has not broken down either.
The latest 20-session resistance stands at HKD 117.00.
Summary Data Alibaba
| Last price | 113.60 HKD |
| Change 1 day / 5 days / 1 month | -2.74% / 2.53% / 10.40% |
| Trend / MA-cross | sideways / none |
| SMA20 / SMA50 | 103.65 / 115.02 |
| RSI (14) / Stochastic %K | 61.1 / 86.0 |
| Bollinger %B / ATR | 77% / 5.89 |
| Support / Resistance 20 days | 89.50 / 117.00 |
| Data as of | 21 Juli 2026 08:30 WIB |


