AstraZeneca Death Cross Pressure: Stock Gains 2.60% (Juli 23, 2026)
On Juli 23, 2026: price 12,702.00 GBp, trend downtrend, RSI 36.3, support 12,364.00, resistance 14,538.00. technical analysis of astrazeneca stock.

According to data from the London Stock Exchange via Yahoo Finance, AstraZeneca’s shares finished at 12,702.00 GBp on 21 July 2026, up 2.60% on the day after a weak month that still leaves the stock 6.53% lower over 1 month. The move matters less as a one-day bounce than as a test of whether the name can stabilise after sliding into a defined downtrend. As shown in the chart, the price is still trading below SMA20 at 13,503.10 and below SMA50 at 13,567.12, while the shorter average has crossed under the longer one in a death cross — a bearish signal that usually means recent prices have weakened enough to drag the trend lower.
Trend & Price Action
The broader picture remains cautious. The stock is sitting in the lower part of its recent range, at about 16% of the 20-day support-resistance band, with support at 12,364.00 and resistance at 14,538.00. That positioning is important because it shows the rebound has not yet reclaimed the middle of the range, let alone the upper boundary where sellers have previously emerged. The SMA20 slope of -1.49% over 5 days reinforces that the short-term trend is still pointing down, not flattening. In practical terms, the market is saying the recent uptick is a recovery attempt inside a wider corrective phase, not yet a clean reversal.
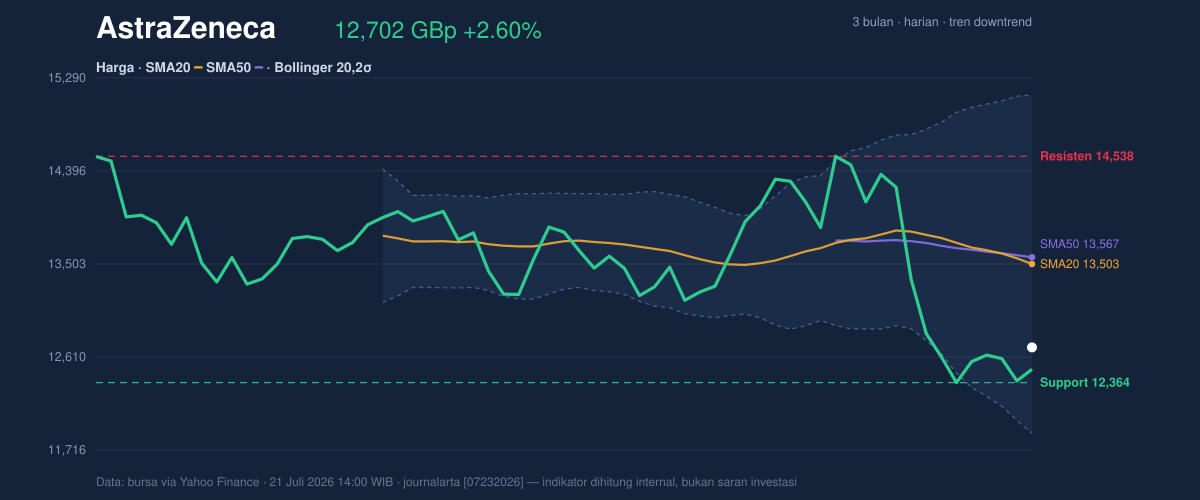
The Bollinger bands add another layer to that reading. The middle band at 13,503.10 sits above the current price, which means the stock is still trading below the short-term equilibrium line. The lower band at 11,878.79 is not far enough away to suggest panic, but it does show where the market could gravitate if the current rebound runs out of steam. With the bands 24.1% wide and widening, volatility is elevated; that usually signals a market preparing for larger swings rather than settling into a quiet drift. A wide band does not choose direction, but in a bearish setup it often means losses and rebounds can both travel faster than usual.
Oscillators & Momentum
The momentum tools are mixed, but not in a way that overrules the trend. RSI at 36.3 is still neutral, though it is close enough to the lower end of the scale to show that buying pressure has been subdued. That is not an oversold reading, so the chart is not flashing a classic rebound signal. The Stochastic %K and %D both at 54.2 are also neutral, which tells us the stock is neither stretched to the upside nor washed out to the downside. In other words, the oscillators are not confirming a strong new leg higher, but they are also not screaming that the recent bounce is exhausted.
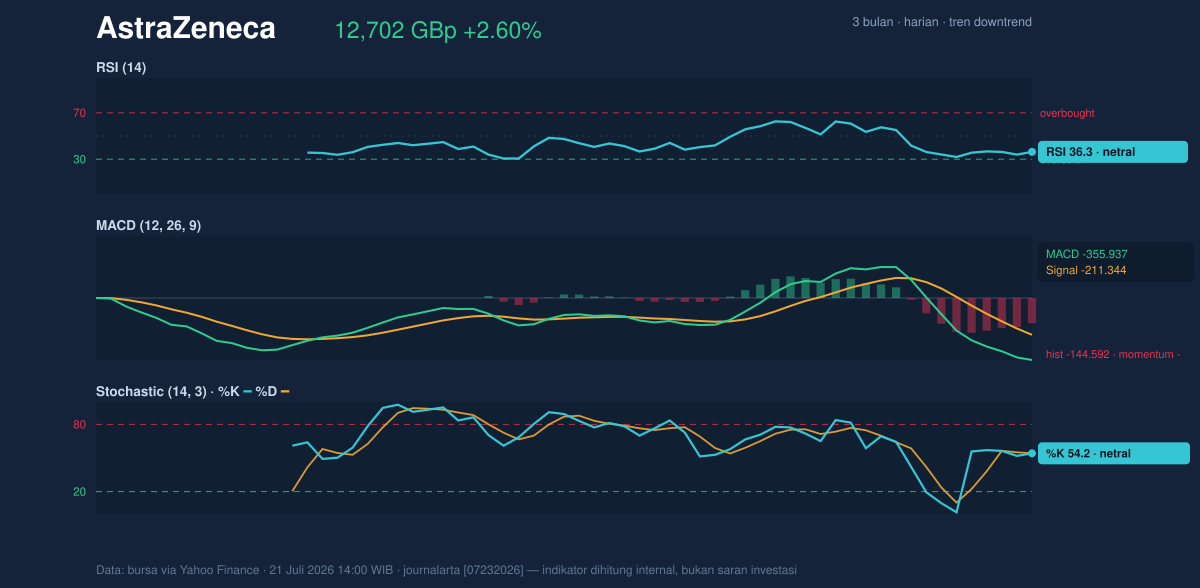
The clearest momentum message comes from MACD. MACD at -355.937, below the signal line at -211.344, with a histogram of -144.592, shows that downside momentum still dominates. The histogram is especially useful because it captures the gap between trend and signal; a negative reading means the bearish impulse remains in place. For readers unfamiliar with the term, MACD is a trend-following indicator, and when it sits below its signal line it usually means the market has not yet built enough upward force to claim a durable turn.
Volatility & Volume
Volume does not yet support the day’s price rise. The latest turnover of 1,829,671 was only 0.7× normal versus the 20-day average of 2,534,389, and OBV is falling. OBV, or on-balance volume, is a cumulative measure that asks whether volume is flowing into the stock on up days or away from it on down days. A declining OBV during a bounce usually means the move is not being broadly confirmed by participation. That makes the advance look more like a short-covering or technical rebound than a full confidence return.
Volatility is also elevated. The ATR(14) at 810.86, equal to 6.4% of price, suggests the stock can move sharply in either direction in the near term. This matters because a high ATR often turns support and resistance into active decision points rather than passive reference lines. If the price loses traction, the move can accelerate toward the lower band more quickly than a low-volatility chart would imply. If it pushes through resistance, the same volatility can help it travel faster, but only if volume begins to improve.
Key Levels & Scenarios
The key line to watch is 12,364.00 support. That level sits just below the last price, so it is close enough to matter immediately. A hold above it would keep the current bounce alive and preserve the possibility of a move back toward 13,503.10, where the SMA20 and Bollinger middle band sit together. Above that, 14,538.00 resistance is the next major barrier, and a move into that zone would show the stock has started to recover the range rather than merely defend the bottom of it.
If 12,364.00 fails, the chart opens toward the lower Bollinger band at 11,878.79, with the wider 3-month range reminding traders that the stock has already traded as low as 9,892.00 over that period. If price reclaims 13,503.10 and then works through 13,567.12, the death-cross damage would begin to look less decisive, but that has not happened yet. For now, the market is still asking whether this bounce can become a trend change or whether it is simply a pause inside a broader decline.
Technical Verdict: HOLD (wait & see)
HOLD (wait & see) is the clearest technical read because the stock is bouncing, but the trend and momentum remain weak.
- Death cross and price below SMA20 and SMA50 keep the trend bearish.
- MACD remains negative, while RSI 36.3 and Stochastic 54.2/54.2 do not yet show a decisive reversal.
- Volume is only 0.7× normal and OBV is falling, so the rebound is not strongly confirmed.
Verdict invalidated if price falls below 12,364.00, because that would break the nearest support and expose the lower Bollinger band at 11,878.79.
- Ideal Entry Range: 12,364.00 to 13,503.10
- Exit Target: 13,503.10, then 14,538.00
- Stop Loss protection: below 11,878.79
In plain English: the share price is trying to recover, but the chart still needs stronger proof before the rebound can be trusted. Volume last printed at 1,829,671.
Summary Data AstraZeneca
| Last price | 12,702.00 GBp |
| Change 1 day / 5 days / 1 month | 2.60% / 2.73% / -6.53% |
| Trend / MA-cross | downtrend / death |
| SMA20 / SMA50 | 13,503.10 / 13,567.12 |
| RSI (14) / Stochastic %K | 36.3 / 54.2 |
| Bollinger %B / ATR | 25% / 810.86 |
| Support / Resistance 20 days | 12,364.00 / 14,538.00 |
| Data as of | 21 Juli 2026 14:00 WIB |


