Momentum Gains, Tencent Stock Drops 7.79% Today
On Juli 23, 2026: price 440.60 HKD, trend sideways, RSI 56.2, support 411.80, resistance 484.00. technical analysis of tencent stock. Momentum Gains — full…

Tencent Holdings fell on the Hong Kong stock exchange on 21 July 2026, with 0700.HK last at HKD 440.60 after a sharp 7.79% one-day decline, even as the broader technical picture still shows a stock that is not in outright breakdown territory. The move leaves Tencent below its SMA20 at 449.76 and just under the SMA50 at 450.91, a positioning that matters because it tells traders the recent bounce has lost traction before it could reclaim the short-term trend line. At the same time, the stock is still sitting inside a wide trading band, with price positioned around the middle-to-lower part of the range rather than at an extreme, which usually means the market is waiting for a clearer catalyst before committing to a direction.
Trend & Price Action
The chart shows Tencent in a sideways trend, but one with a slightly fragile tone: the SMA20 slope is still positive at 1.65% over 5 days, yet the share price has slipped below both the SMA20 and SMA50. That combination is important. It suggests the intermediate trend is not decisively bearish, but buyers have not been strong enough to keep price above the average levels that often act as a simple measure of market acceptance. There is also no fresh MA-cross, so the chart is not giving a clean trend reversal signal either way.
The broader range reinforces that reading. Tencent is trading well below the 3-month high of 514.50 and still above the 3-month low of 411.00, while the 20-hour support at 411.80 sits very close to that floor. In plain terms, the stock is not collapsing, but it is losing altitude inside a range that still has room to absorb more selling if support gives way.
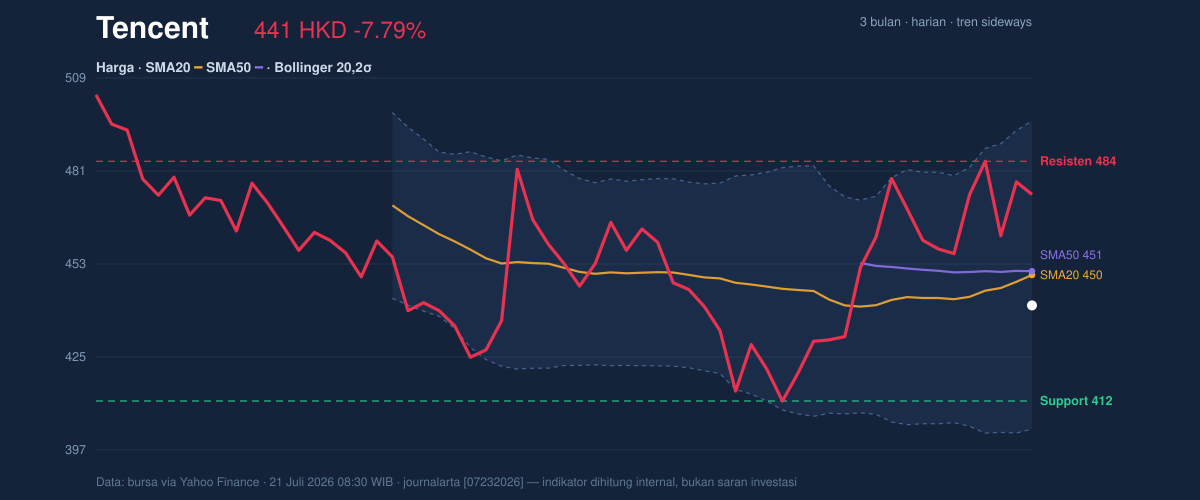
Price is now in the lower half of its recent corridor, which makes the next support test more important than the last rebound.
Oscillators & Momentum
The momentum tools are more constructive than the price action alone would suggest. Tencent’s RSI at 56.2 is neutral, meaning the share is neither stretched on the upside nor deeply washed out on the downside. That matters because the one-day drop has not yet pushed the stock into an oversold condition, so there is still room for further weakness before momentum traders would typically call the move exhausted. The Stochastic reading of 70.0 / 68.7 is also neutral, but it is leaning toward the upper side of the range, which hints that the stock had been recovering before the latest setback.
Most notable is the MACD at 7.313 above its signal line at 3.995, with a positive histogram of 3.318. MACD measures whether recent price movement is accelerating or fading; here it says underlying momentum remains positive even though the share price has dipped under its moving averages. That divergence is the key signal in this name: the chart is not yet confirming a full trend breakdown, but the price is clearly behaving worse than the momentum backdrop.
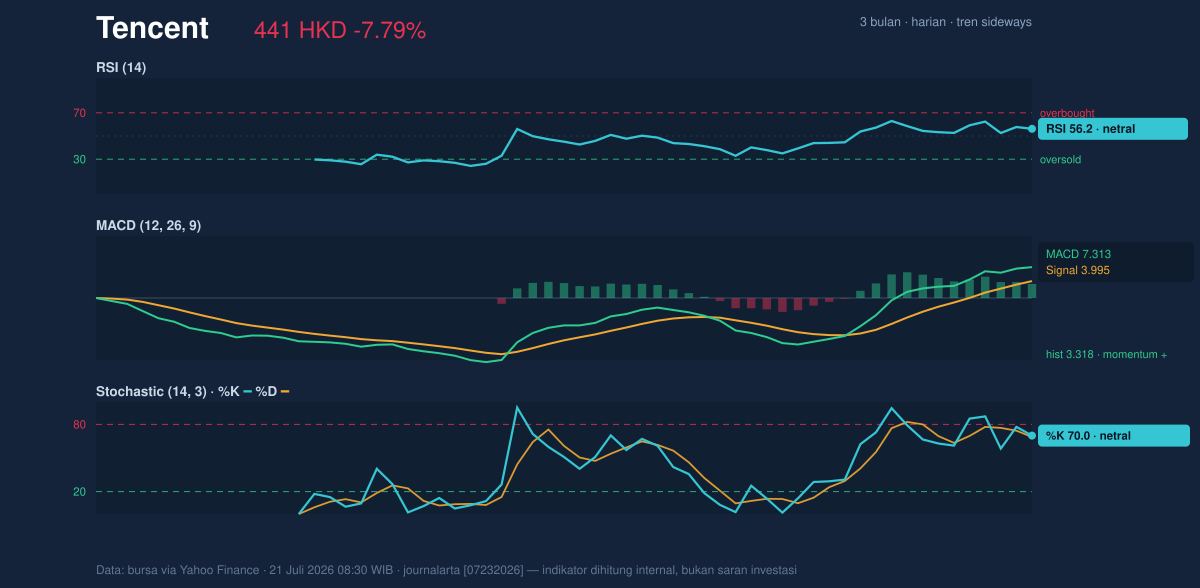
MACD is still positive, while RSI and Stochastic remain neutral, so the technical message is mixed rather than decisively bearish.
Volatility & Volume
Volatility has picked up. The Bollinger Bands are wide, with a 20.6% spread, and ATR(14) at 19.70 equals 4.5% of price, both of which point to a market that can move quickly once it chooses a direction. In practical terms, a wider Bollinger structure means the stock is no longer in a tight compression phase; price swings are likely to be larger than usual, and false breaks can happen if volume does not confirm them. Tencent’s %B at 40% places the share below the middle of the band, leaning toward the lower half without touching the lower band at 403.36. That positioning suggests the stock is under pressure, but not yet in a statistically stretched oversold zone.
Volume is the part of the picture that weakens the bearish case. Last turnover of 21,362,780 was only 0.6× the 20-hour average of 36,679,594, and OBV is falling. Lower volume on a sharp down day can mean the move lacks broad participation, but a falling OBV still tells the same story: money flow has not been supporting the price. That is a warning sign for anyone looking for an immediate recovery, because rallies built on thin participation tend to fade quickly.
Volatility is high, but participation is light, so the market is moving without strong conviction.
Key Levels & Scenarios
The nearest level that matters is support at HKD 411.80, which sits just above the 3-month low of 411.00. If that area holds, Tencent could continue to trade inside the current range and attempt to recover back toward the moving averages. If it fails, the chart would be signaling that the lower boundary of the range has been breached, and the recent sideways structure would be at risk of turning into a deeper correction.
On the upside, the first important checkpoint is resistance at HKD 484.00. That level is well above the current price and lines up with the upper part of the recent range. A move back through that zone would show that the market has regained enough strength to challenge the recent slide and start rebuilding a more constructive structure. Until then, the stock remains below the averages and below the middle of the Bollinger channel, which keeps the burden of proof on the buyers.
Support at HKD 411.80 is the line traders will watch most closely; resistance at HKD 484.00 is the first real test of regained strength.
Technical Verdict: HOLD (wait & see)
HOLD (wait & see)
- MACD remains positive, which argues the broader momentum has not fully rolled over.
- Price is below SMA20 and SMA50, showing near-term weakness and a loss of short-term trend control.
- Volume is only 0.6× average and OBV is down, so the latest drop lacks the kind of participation that usually marks a clean reversal or a strong breakdown.
- Verdict invalidated if price falls below HKD 411.80, because that would threaten the range floor near 411.00 and shift the chart toward a deeper downside test.
- Ideal Entry Range: HKD 411.80–449.76
- Exit Target (Target Price): HKD 484.00
- Stop Loss protection: Below HKD 403.36
For non-traders, this means Tencent is not giving a clean green light or red light yet — the chart says wait for the market to prove whether the recent weakness is just a pause or the start of something worse.
“We’re still inside the range, but the market is testing patience.”
Summary Data Tencent
| Last price | 440.60 HKD |
| Change 1 day / 5 days / 1 month | -7.79% / -3.42% / 1.76% |
| Trend / MA-cross | sideways / none |
| SMA20 / SMA50 | 449.76 / 450.91 |
| RSI (14) / Stochastic %K | 56.2 / 70.0 |
| Bollinger %B / ATR | 40% / 19.70 |
| Support / Resistance 20 days | 411.80 / 484.00 |
| Data as of | 21 Juli 2026 08:30 WIB |


