Momentum Weakens, QCOM Stock Gains 1.23% Today
On Juli 23, 2026: price 175.63 USD, trend downtrend, RSI 42.4, support 170.32, resistance 204.90. technical analysis of qcom stock. Momentum Weakens — full…

Qualcomm fell to 175.63 USD on Nasdaq in New York on 22 July 2026, extending a slide that has left the chipmaker trading below its 20-day average of 183.08 and far under the 50-day average of 205.23. The stock’s latest 1.23% daily rise did little to change the broader picture: the shares are still down 1.32% over five days and 13.96% over one month, a pattern that signals persistent selling pressure rather than a one-day rebound. In plain terms, the market is still treating recent strength as a pause inside a downtrend, not as proof of a turn.
Trend & Price Action
The chart, as shown in the price-action view, places Qualcomm in a clear downtrend, with the SMA20 sloping down 5.60% over five days. That slope matters more than the day’s green close: a falling short-term average means recent prices have been consistently weaker, and that usually keeps rallies contained until buyers can reclaim the average itself. The stock is also sitting well below the SMA20 at 183.08, which now acts as the first technical ceiling, while the SMA50 at 205.23 marks a much heavier overhead barrier.
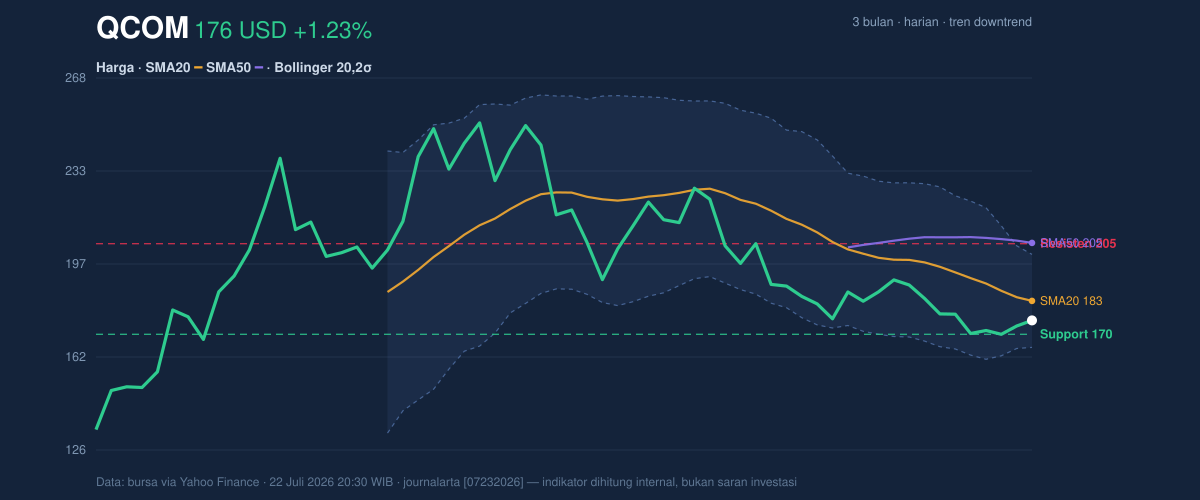
The Bollinger bands reinforce that message. Qualcomm is trading near the lower half of its band structure, with %B at 29%, meaning the price is closer to the lower band than the upper band and still lacks the kind of push that usually accompanies a sustained trend reversal. The band width is 19.4%, described as normal, so this is not a squeeze setup waiting for a violent breakout; it is a regular volatility environment in which the current trend remains the dominant force.
One short line says it best: the stock is still trying to stop falling.
Oscillators & Momentum
Momentum indicators are mixed, but not in a way that favors a decisive reversal. The RSI at 42.4 is neutral, which tells readers the stock is neither deeply oversold nor overbought. In other words, the market has not reached the kind of extreme that often forces a quick snapback. The Stochastic %K at 34.7 and %D at 26.8 are also neutral, showing that short-term momentum is weak but not yet stretched to a classic reversal zone.
The more important signal comes from MACD. The chart shows MACD at -8.357, below the signal line at -7.731, with a histogram of -0.626. That combination means downside momentum is still present: the faster trend measure remains weaker than the slower signal, so the stock has not yet generated a clean bullish crossover. For general readers, this is the technical equivalent of a car still rolling downhill even if the driver has eased off the accelerator.
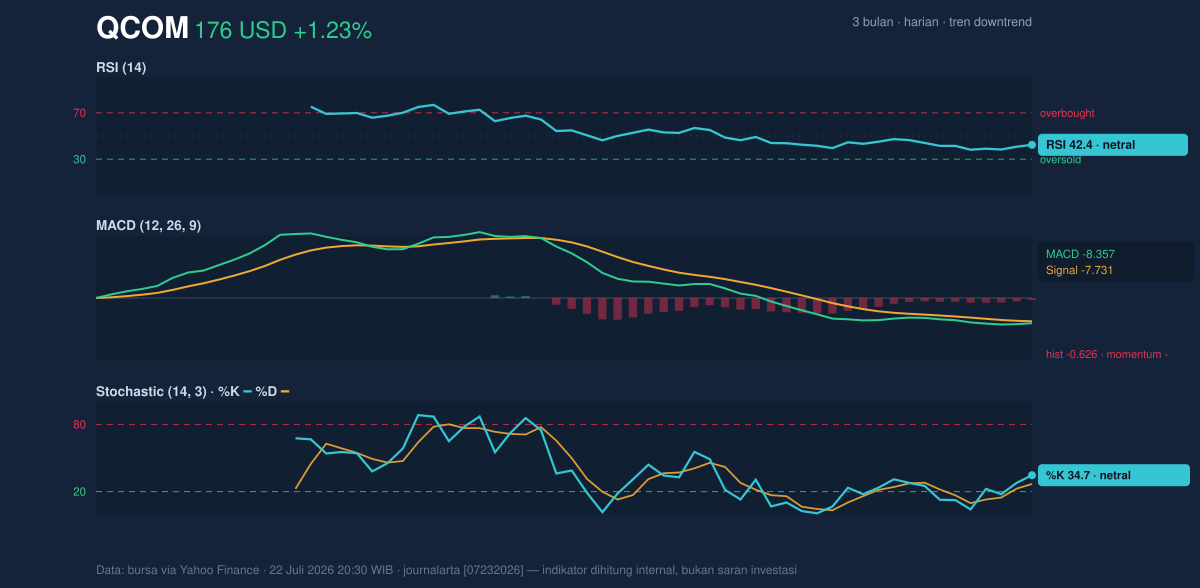
So while momentum is not oversold, it is still tilted against the bulls.
Volatility & Volume
Volatility is elevated enough to matter. The ATR(14) at 8.38, equal to 4.8% of price, suggests Qualcomm can move meaningfully in either direction within a short period. That is important because a stock in a downtrend with higher volatility can test support quickly if sellers regain control. At the same time, the latest volume of 7,768,100 was only about 0.5× the 20-day average of 17,177,200, and OBV is falling. OBV, or on-balance volume, tracks whether trading activity is broadly supporting price direction; a declining reading means the recent move has not been backed by strong accumulation.
That volume profile weakens the case for the day’s bounce. A meaningful reversal usually wants participation. Qualcomm did not get that.
Key Levels & Scenarios
The nearest support is 170.32, while resistance stands at 204.90. With the stock at 175.63, it is sitting in the lower part of its range, roughly 15% into the 20-day band between those levels. That placement is telling: the market is closer to support than resistance, but not close enough to say the floor has been tested and held convincingly. The broader three-month range, from 132.05 to 259.92, shows there is still a wide historical corridor, but the recent price structure is clearly leaning toward the lower half of that span.
If 170.32 fails, the chart would likely invite another leg lower, because there is little evidence of strong volume-backed defense nearby. If price can reclaim 183.08, the short-term damage eases, though the bigger test remains 205.23, where the 50-day average and prior resistance-style overhead pressure converge.
Technical Verdict: HOLD (wait & see)
HOLD (wait & see) fits best because the stock is still below SMA20 and SMA50, MACD remains negative, and OBV is falling, all of which argue that the downtrend has not been neutralized. The neutral RSI and Stochastic show the stock is not deeply washed out, so the chart does not yet offer a strong reversal signal. The only bullish element is the day’s bounce, but it arrived on light volume, which limits its credibility.
- Ideal entry range: 170.32 to 183.08, where support and the 20-day average define the most relevant technical zone.
- Exit target: 200.82 to 204.90, using the Bollinger upper band and nearby resistance as the first upside markers.
- Stop loss protection: below 165.34, the lower Bollinger band, or more conservatively just under 170.32 if support fails.
- Verdict invalidated if price breaks below 170.32 on firm volume, because that would confirm the current support has not held.
For non-traders: Qualcomm is still in a weak technical position, and the chart needs stronger proof of recovery before the recent bounce can be trusted.
Summary Data QCOM
| Last price | 175.63 USD |
| Change 1 day / 5 days / 1 month | 1.23% / -1.32% / -13.96% |
| Trend / MA-cross | downtrend / none |
| SMA20 / SMA50 | 183.08 / 205.23 |
| RSI (14) / Stochastic %K | 42.4 / 34.7 |
| Bollinger %B / ATR | 29% / 8.38 |
| Support / Resistance 20 days | 170.32 / 204.90 |
| Data as of | 22 Juli 2026 20:30 WIB |


