Momentum Weakens, UOB Stock Gains 0.89% Today
On Juli 23, 2026: price 43.04 SGD, trend uptrend, RSI 59.2, support 39.65, resistance 44.95. technical analysis of uob stock. Momentum Weakens — full details…

United Overseas Bank’s shares on SGX rose to 43.04 SGD on 21 July 2026, up 0.89% from the previous close, but the move sits inside a broader near-term pullback that has left the stock 3.02% lower over five days even as it remains 8.03% higher over one month. That mix matters: it says buyers have not lost control of the larger trend, yet the latest bounce has not fully repaired the short-term damage, which is why the chart now looks more like a consolidation inside an uptrend than a clean breakout, as shown in the chart.
Trend & Price Action
UOB is still trading in an uptrend, and the slope of the SMA20 at 2.28% over five days shows the short-term average is rising rather than flattening out. The share price is also holding above the SMA20 at 41.91 and comfortably above the SMA50 at 39.67, which is usually the key sign that medium-term buyers remain in command. There is no new MA-cross, so the chart is not flashing a fresh trend acceleration signal; instead, it suggests the earlier positive structure is still intact but needs more follow-through.
The price is sitting around 64% of its 20-hour range, with support at 39.65 and resistance at 44.95. That position is important because it shows the stock is closer to the upper half of the range without yet testing the ceiling. It is also still below the 3-month high of 45.15, so the market has not yet confirmed a full re-test of recent peaks.
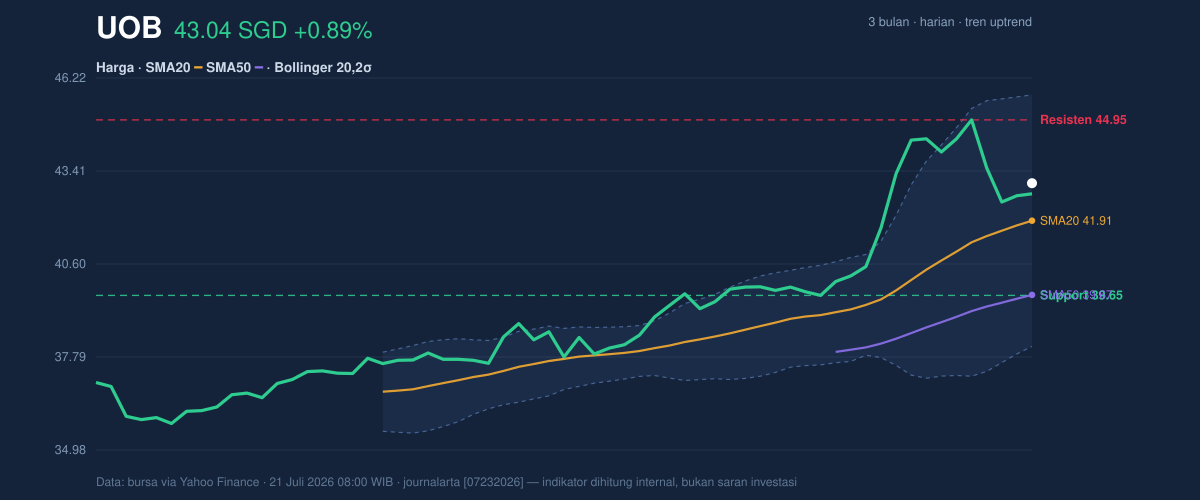
The Bollinger Band structure reinforces that reading. With the middle band at 41.91, the price is above the midline but not stretched near the top band at 45.71. The %B at 65% means the stock is trading in the upper-middle portion of its band, which usually signals constructive momentum without obvious overheating. The 18.1% band width is normal, so this is not a volatility squeeze that often precedes a sharp breakout; nor is it an expansion that would suggest panic or forced repositioning.
Oscillators & Momentum
The momentum picture is more restrained than the trend picture. RSI at 59.2 is neutral-to-firm rather than overbought, which means the stock still has room to extend without immediately running into momentum fatigue. The Stochastic %K at 56.5 and %D at 55.0 are also neutral and closely aligned, a sign that the short-term price rhythm is balanced rather than extreme.
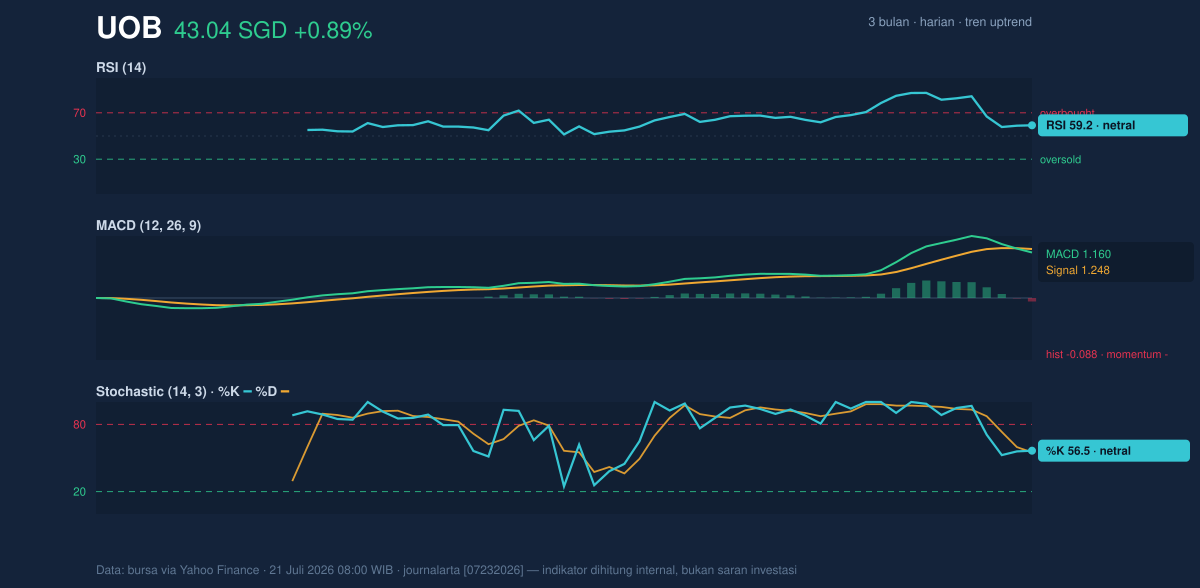
The caution flag comes from the MACD at 1.160 versus its signal line at 1.248, with a histogram of -0.088. In plain terms, MACD is still positive, so the broader momentum backdrop has not turned bearish, but it is running slightly below its signal line, which means the latest push has lost a bit of force. That divergence matters because it often appears when price is drifting higher on decent trend support, yet the pace of gains is slowing. For a stock already near the upper part of its range, that is a reason to watch for confirmation rather than assume continuation.
Volatility & Volume
Volatility is moderate. The ATR(14) of 0.99, equal to 2.3% of price, suggests daily movement is large enough to matter but not erratic enough to imply disorderly trading. That makes the current setup more about level testing than a volatility shock.
Volume adds a useful nuance. Last trade volume of 3,511,300 was only slightly above the 20-hour average of 3,428,541, or about 1.0× normal. That is not the kind of surge that usually marks a decisive breakout or a capitulation move. Still, OBV is rising, and that is an encouraging sign because on-balance volume tracks whether money is accumulating over time. Rising OBV while price holds above the moving averages suggests underlying participation is still supportive, even if the latest session was not explosive.
Key Levels & Scenarios
The immediate technical map is straightforward. Support at 39.65 lines up close to the lower end of the recent structure and would be the first level where buyers have to prove they can defend the trend. Below that, the SMA50 at 39.67 reinforces the same zone, making it a meaningful floor rather than a random number. On the upside, resistance at 44.95 is the first barrier, and the 3-month high at 45.15 sits just above it, so the stock needs to clear a tight cluster before the chart opens up.
If price pushes through 44.95 and then 45.15, the market would be signaling that the recent pause has ended and the uptrend is regaining traction. If it fails there and slips back under 41.91, that would suggest the current bounce is losing strength and the stock is reverting toward the middle of its range. A break below 39.65 would be the more serious warning, because it would place the price back under both the short-term support zone and the SMA50, weakening the trend structure that has been supporting the shares.
Technical Verdict: HOLD (wait & see)
HOLD (wait & see) fits best because the stock is still above the SMA20 and SMA50, but MACD is slightly negative versus its signal line, showing momentum is not fully confirming the trend. The Bollinger setup is normal, not a breakout squeeze, so the chart does not yet show the kind of compression that often leads to a decisive move. OBV is rising, which is constructive, but volume is only around 1.0× normal, so participation is supportive rather than emphatic.
- Ideal Entry Range: 41.91 to 39.65
- Exit Target: 44.95 to 45.15
- Stop Loss Protection: below 39.65
This means the stock is technically steady, but the next move still needs confirmation from price, not just from the trend line.
The verdict is invalidated if price breaks below 39.65, because that would put UOB back under the key support and the SMA50.
Summary Data UOB
| Last price | 43.04 SGD |
| Change 1 day / 5 days / 1 month | 0.89% / -3.02% / 8.03% |
| Trend / MA-cross | uptrend / none |
| SMA20 / SMA50 | 41.91 / 39.67 |
| RSI (14) / Stochastic %K | 59.2 / 56.5 |
| Bollinger %B / ATR | 65% / 0.99 |
| Support / Resistance 20 days | 39.65 / 44.95 |
| Data as of | 21 Juli 2026 08:00 WIB |


