NVDA Stock Gains 2.30% Today, Testing Key Resistance
On Juli 23, 2026: price 212.06 USD, trend sideways, RSI 56.2, support 192.53, resistance 212.50. technical analysis of nvda stock. NVDA Stock Gains — full…

Nvidia rose to 212.06 USD on Nasdaq on 22 July 2026, after closing at 207.29, as the stock pushed back to the top of its recent trading band. The move was modest in one sense, but technically important in another. It left the shares just under a nearby ceiling while keeping the broader trend intact, a setup that often tells traders more about pressure building than about a decisive breakout already achieved.
Trend & Price Action
As shown in the chart, NVDA is still moving in a sideways trend, with the SMA20 at 202.29 and the SMA50 at 209.68. That matters because the price is now above the SMA20 and also slightly above the SMA50, which suggests the market has recovered enough to sit on the stronger side of its short- to medium-term averages, even if it has not established a clean directional trend.
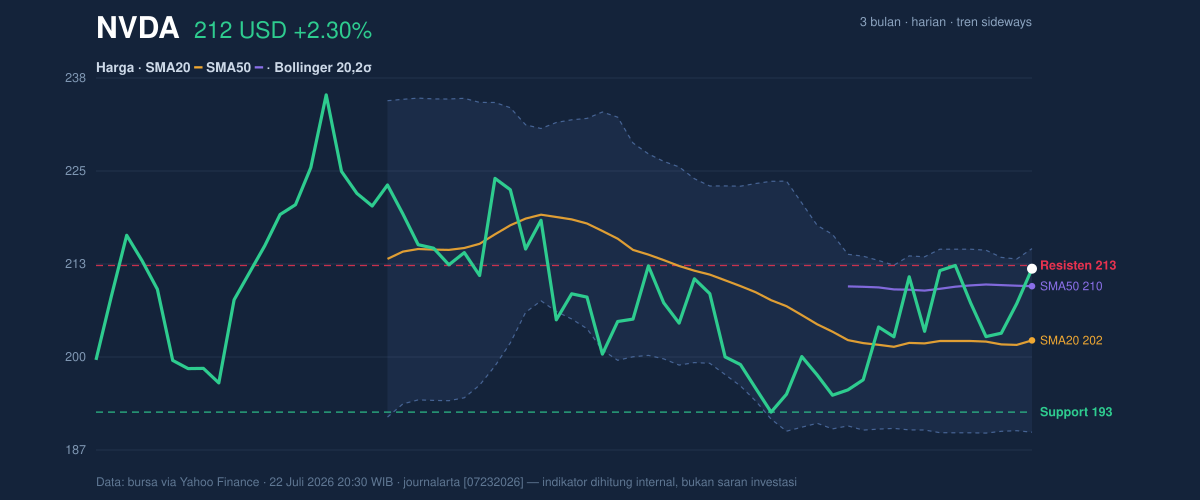
The slope of the SMA20 at 0.03% over 5 days is almost flat, signaling that the recent advance has not yet turned into a sustained trend. In plain language, the stock is leaning upward, but only just. The current price is also at 98% of the 20-hour range, which shows it is pressing against the upper edge of the recent band rather than sitting in the middle. That often means the market is testing whether buyers are strong enough to absorb supply near resistance.
The key short-term marker is resistance at 212.50, with support at 192.53. The spread between those levels is wide enough to leave room for movement, but the stock is already trading close to the top of that range, so the next few sessions will likely be defined by whether it can hold above that ceiling rather than by the size of today’s gain alone.
Oscillators & Momentum
The momentum picture is more mixed than the price action alone suggests. The RSI at 56.2 is neutral, which means the stock is not stretched enough to imply exhaustion on its own. That is important: RSI is not flashing danger, but it is also not confirming a strong breakout. It says the stock has room to move, but no clear momentum extreme.
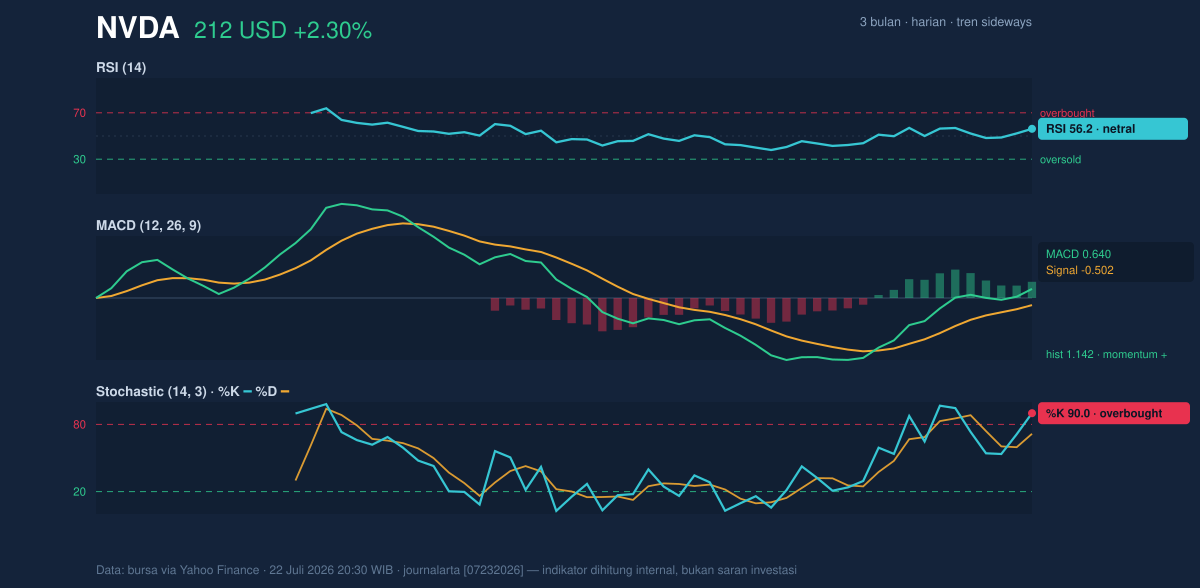
By contrast, the Stochastic %K at 90.0 and %D at 71.6 are in overbought territory. That does not automatically mean a reversal, but it does mean the stock is trading near the upper end of its recent range and may need a pause or consolidation before extending further. In practical terms, stochastic is warning that the near-term move has become crowded, even if it has not yet rolled over.
The more constructive signal comes from the MACD at 0.640, with the signal line at -0.502 and a histogram of 1.142. This is a positive momentum reading: the MACD is above its signal, and the widening histogram shows that upside force is still present. So while stochastic says the stock is near a short-term limit, MACD says the underlying push has not disappeared. That combination often appears when a stock is strong but extended.
Volatility & Volume
Volatility remains elevated. The ATR(14) at 7.46, or 3.5% of price, tells us daily swings are still large enough to matter. This is not a quiet tape. When ATR is this high, small changes in sentiment can translate into meaningful moves, which is why nearby support and resistance levels carry extra weight.
The Bollinger Bands frame that tension well: the upper band is 214.80, the middle band is 202.29, and the lower band is 189.78. The price is sitting at %B 89%, which means it is trading close to the upper band. That usually signals strength, but it also shows the stock is no longer cheap relative to its recent volatility envelope. The band width of 12.4% is normal, not a squeeze, so the market is not coiled for a dramatic expansion yet. Instead, it looks like a stock already in motion, with room to continue if buyers keep control.
Volume supports that reading. Last volume was 137,220,500, roughly 1.0× normal versus the 20-hour average of 135,884,400, while OBV is rising. That matters because rising OBV suggests money flow is still accumulating rather than quietly fading. In other words, the move is not being made on weak participation.
Key Levels & Scenarios
The main technical question is whether NVDA can hold above the nearby resistance it is now testing. If it clears and sustains above 212.50, the next reference becomes the upper Bollinger band at 214.80. If it fails there, the stock could slip back toward the SMA50 at 209.68, then the SMA20 at 202.29, where the middle Bollinger band also sits. A deeper fade would bring 192.53 into focus as the first major support from the 20-hour range.
The broader context also matters. NVDA’s 3-month high is 236.54 and the 3-month low is 189.80. That puts the current price in the upper half of the recent three-month range, but still well below the peak. So the stock has repaired part of its earlier decline, yet it has not reclaimed the territory that would signal a full trend reset.
Technical Verdict: HOLD (wait & see)
HOLD (wait & see) is the cleanest read from the chart because momentum is positive, but the stock is also pressing into resistance with overbought stochastic signals.
Reasons:
- MACD is positive and the histogram is still expanding, which supports upside momentum.
- Price is above the SMA20 and SMA50, showing the stock is holding its short-term structure.
- Stochastic is overbought and price is near 212.50 resistance, so the setup is extended rather than cleanly fresh.
Verdict invalidated if price breaks below 192.53.
- Ideal Entry Range: 202.29 to 209.68
- Exit Target: 214.80
- Stop Loss protection: 192.53
In plain English, the chart says Nvidia is strong enough to stay interesting, but not clean enough yet to call a fresh breakout.
Summary Data NVDA
| Last price | 212.06 USD |
| Change 1 day / 5 days / 1 month | 2.30% / -0.21% / 6.01% |
| Trend / MA-cross | sideways / none |
| SMA20 / SMA50 | 202.29 / 209.68 |
| RSI (14) / Stochastic %K | 56.2 / 90.0 |
| Bollinger %B / ATR | 89% / 7.46 |
| Support / Resistance 20 days | 192.53 / 212.50 |
| Data as of | 22 Juli 2026 20:30 WIB |


