OCBC Stock Gains 1.71% Today, RSI Overbought
On Juli 23, 2026: price 29.18 SGD, trend uptrend, RSI 81.5, support 24.66, resistance 28.78. technical analysis of ocbc stock. OCBC Stock Gains — full details…

OCBC Bank’s shares on SGX extended their climb to SGD 29.18 by 21 July 2026 08:00 WIB, after a 1.71% one-day rise, with the move arriving just above the stock’s recent trading ceiling and into fresh high ground for the past three months. The price action matters because it is not happening in isolation: the shares are trading well above both short- and medium-term averages, while momentum indicators are now flashing a warning that the advance has become stretched even as the trend still points higher.
Trend & Price Action
The chart shows OCBC in a clear uptrend, with the share price sitting above the SMA20 at SGD 26.56 and the SMA50 at SGD 24.84. That positioning usually signals that buyers have remained in control for long enough to pull the average price higher, and the fact that the SMA20 is rising at 3.63% over five days reinforces that the short-term trend is still accelerating rather than flattening.
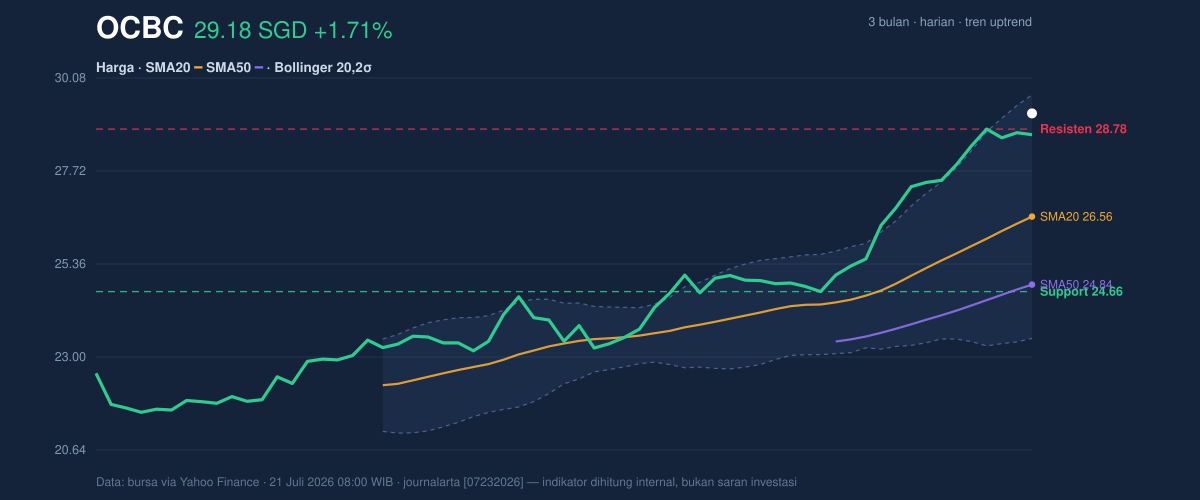
What stands out, however, is how far the stock has travelled within its recent range. The 20-day resistance at SGD 28.78 has already been exceeded, and the price is now trading above the 3-month high of SGD 28.99. In practical terms, that means the market is no longer reacting to a known ceiling; it is trying to establish whether this breakout can hold. The 20-day support at SGD 24.66 remains the first obvious floor if sentiment cools, while the gap between current price and support shows how much of the recent gain is now exposed to any pullback.
Oscillators & Momentum
The momentum picture is less comfortable than the trend picture. The RSI(14) at 81.5 and Stochastic %K at 91.9 / %D at 93.3 both sit in overbought territory, which tells readers that the stock has risen so quickly that short-term traders may already be crowded on the same side of the trade. Overbought does not mean an immediate reversal, but it does mean the market is vulnerable to pauses, profit-taking, or a brief shakeout if new demand slows.
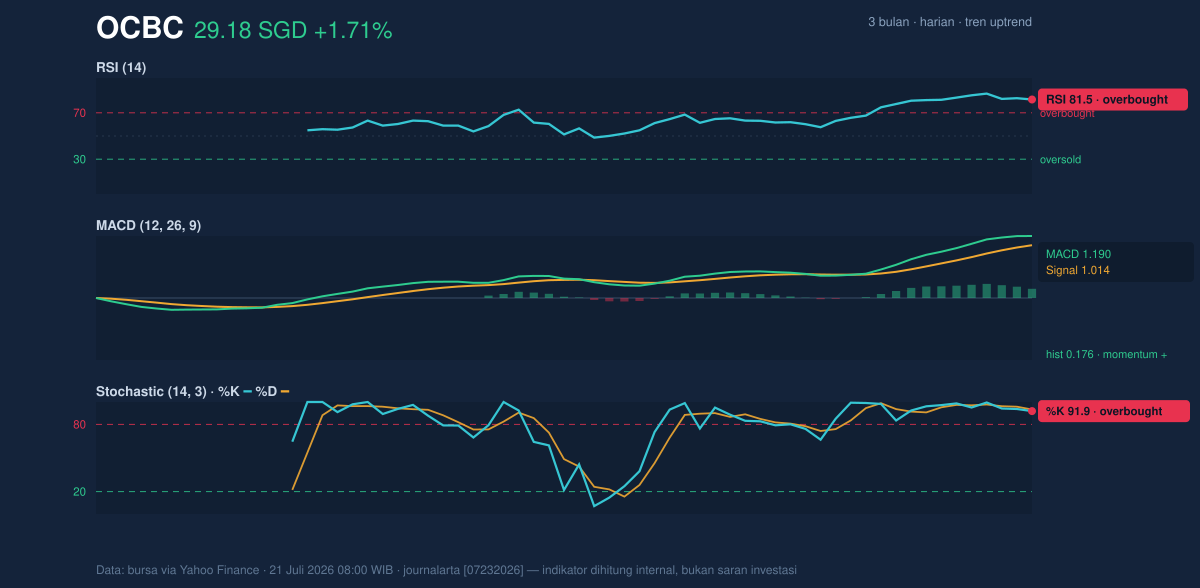
That caution is balanced by the MACD, which is still positive. The MACD at 1.190 remains above the signal line at 1.014, leaving a histogram of 0.176. In plain language, the trend’s engine is still running, but the overbought oscillators suggest it may be running hot. When MACD stays constructive while RSI and Stochastic are stretched, the usual message is not “trend over,” but “trend extended.”
Volatility & Volume
Volatility is also telling a useful story. The Bollinger upper band at SGD 29.65 is now close overhead, with the price sitting at a %B of 92%, meaning OCBC is trading near the top of its recent volatility envelope. The 23.2% Bollinger band width shows the bands are expanding, which typically happens when a market is breaking out or repricing quickly. Expansion can support further upside, but it also means the stock is less likely to move quietly from here.
The ATR(14) at SGD 0.55, or 1.9% of price, suggests day-to-day swings are still manageable rather than explosive. That is important because the latest advance is not just a thin, low-participation drift higher. Volume reached 7,542,400, about 1.3x the 20-day average of 5,751,799, and OBV is rising. Rising volume and rising OBV together indicate that the move has been supported by participation, not just by price alone. In technical analysis, that is usually a healthier sign than a rally on fading turnover.
Key Levels & Scenarios
The immediate battle is now around whether OCBC can hold above the old resistance zone that it has just crossed. The SGD 28.78 resistance has turned into the first important reference point, while the SGD 29.65 Bollinger upper band marks the near-term stretch zone. If the share price continues to hold above those levels, the breakout narrative remains intact. If it slips back below them, the market may interpret the move as an overextension rather than a clean trend continuation.
On the downside, the SGD 26.56 SMA20 is the first dynamic support to watch, followed by the SGD 24.66 support. A break below the 20-day average would not cancel the broader uptrend immediately, but it would show that the latest surge is losing momentum. A fall through SGD 24.66 would be more serious, because that level sits close to the lower edge of the recent trading structure and would suggest the breakout has failed to attract follow-through.
Technical Verdict: HOLD (wait & see)
The technical setup remains constructive, but the stock is now overbought and trading near the Bollinger upper band, so the risk-reward balance looks less attractive than it did earlier in the move. The MACD remains positive, the price is above the SMA20 and SMA50, and volume is running above average with OBV rising, all of which support the trend. Still, the RSI at 81.5 and Stochastic at 91.9/93.3 warn that the rally may need to cool before it can extend cleanly.
- Ideal Entry Range: SGD 26.56 to SGD 28.78
- Exit Target: SGD 29.65 and, if that is cleared, continued breakout monitoring above that band
- Stop Loss protection: below SGD 24.66
Verdict invalidated if price breaks below 24.66.
In plain English: the stock still looks strong, but it has already run far enough that the next move matters more than the last one. The next scheduled reference point is the market’s ability to hold above SGD 28.78 and the SGD 29.65 upper Bollinger band.
Summary Data OCBC
| Last price | 29.18 SGD |
| Change 1 day / 5 days / 1 month | 1.71% / 4.66% / 16.39% |
| Trend / MA-cross | uptrend / none |
| SMA20 / SMA50 | 26.56 / 24.84 |
| RSI (14) / Stochastic %K | 81.5 / 91.9 |
| Bollinger %B / ATR | 92% / 0.55 |
| Support / Resistance 20 days | 24.66 / 28.78 |
| Data as of | 21 Juli 2026 08:00 WIB |


