PEP Testing Support Level: Stock Gains 0.48% (Juli 23, 2026)
On Juli 23, 2026: price 135.65 USD, trend downtrend, RSI 41.3, support 135.00, resistance 144.98. technical analysis of pep stock. PEP Testing Support Level —…

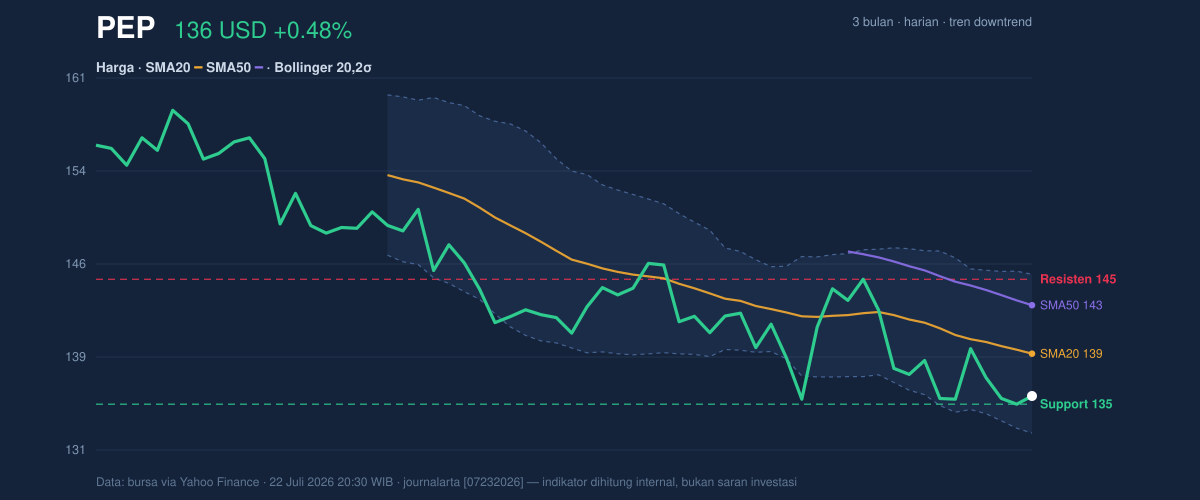
PepsiCo shares edged up to 135.65 on Nasdaq, but the move sits inside a broader drift lower: the stock is still below its 20-day moving average at 139.03 and below its 50-day moving average at 142.91, while the 20-day average itself is sloping down at -1.06% over five days. That matters because it shows the recent bounce is happening under overhead pressure, not in a clean trend reversal. The latest print also leaves PepsiCo near the lower end of its recent range, with the shares trading just above the 20-hour support at 135.00 and well under the 20-hour resistance at 144.98.
Trend & Price Action
The chart shows a stock that is trying to stabilize, but not yet proving it can reclaim lost ground. Price below SMA20 usually means short-term sellers still control the tape, while price below SMA50 suggests that weakness is not just a one-week wobble but part of a larger reset in sentiment. There is no new moving-average cross to signal a fresh trend change, so the market has not received the kind of technical confirmation that often marks a durable turn.
That said, PepsiCo is not collapsing. The shares are up 0.48% on the day and 0.18% over five days, which tells us the stock is finding some demand on dips. But the broader -4.51% move over one month says that buyers have not yet regained control. The stock is also sitting above the 3-month low of 133.95, which makes the current area important: it is close enough to recent lows that any failure here could quickly expose that floor again.
Oscillators & Momentum
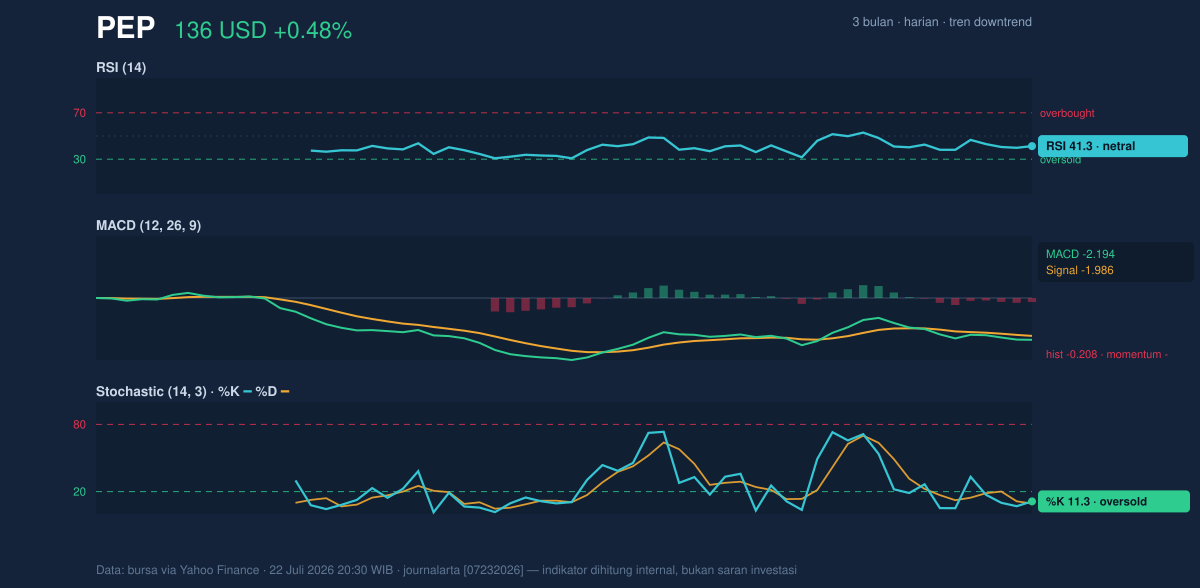
Momentum is mixed, and that mix is exactly what makes the current setup interesting. RSI at 41.3 is neutral-to-soft, which means the stock is not deeply oversold, but it is also not showing enough strength to suggest a strong rebound has already taken hold. By contrast, Stochastic %K at 11.3 and %D at 9.4 are in oversold territory, a sign that the stock has been under pressure enough to stretch the short-term move. In plain terms, the oscillator is saying the selling may be tired in the very near term, but tired does not automatically mean reversed.
The MACD at -2.194 remains below its signal line at -1.986, and the -0.208 histogram confirms that downside momentum is still present. This is the key tension in the chart: the stochastic is flashing a short-term exhaustion signal, while MACD is still arguing that the trend has not yet turned. When those two disagree, traders usually treat any bounce as a test, not proof.
Volatility & Volume
Volatility is present, but not extreme. The ATR at 3.70 equals about 2.7% of price, which suggests PepsiCo can still move meaningfully in either direction without looking chaotic. The Bollinger Bands help frame that move: with the lower band at 132.69, middle band at 139.03, and upper band at 145.38, the stock is trading in the lower part of its band structure. The %B at 23% shows price is closer to the lower band than the middle, which is another way of saying the market is priced toward weakness rather than strength.
The 9.1% Bollinger width is normal, not compressed. That means there is no obvious squeeze building for a sharp breakout, but there is enough room for a directional move if a catalyst appears. Volume does not yet confirm a meaningful turn: the latest volume of 6,197,000 is only 0.7x normal versus the 20-day average of 9,487,940, and OBV is falling. That combination matters because a rebound on light volume often lacks conviction; falling OBV suggests the shares are still seeing more accumulation of distribution than the other way around.
Key Levels & Scenarios
The market is now focused on a narrow band of decision points. 135.00 is the nearest support, and it also sits just above the 3-month low at 133.95. If that zone gives way, the chart would be vulnerable to another leg lower because there is little technical cushion beneath it in the data provided. On the upside, 139.03 — the SMA20 and Bollinger middle band — is the first hurdle that matters, because reclaiming it would show the stock is at least back inside its short-term average range. Above that, 142.91 and then 144.98 mark the next layers of resistance, with 145.38 at the upper Bollinger band acting as the ceiling for a stronger recovery attempt.
The current position — 7% of the way up from support to resistance — says the stock is still leaning toward the lower end of its recent trading band. That is not a breakdown, but it is also not a clean recovery. The chart is asking a simple question: can PepsiCo hold the low-135 area long enough for momentum to rebuild, or does the weak volume and negative MACD drag it back toward the recent low?
Technical Verdict: HOLD (wait & see)
HOLD (wait & see)
- Why: Price is below SMA20 and SMA50, so the trend remains under pressure.
- Why: MACD is negative and OBV is falling, which means momentum and participation still lean weak.
- Why: Stochastic is oversold, so a short-term bounce is possible, but the signal is not strong enough to confirm a trend reversal on its own.
- Invalidation: This verdict is invalidated if price falls below 133.95, the 3-month low.
- Ideal Entry Range: 135.00 to 139.03
- Exit Target: 142.91 to 144.98
- Stop Loss protection: Below 133.95
For non-traders, this means PepsiCo is showing signs of short-term exhaustion, but the chart has not yet proved that the decline is over. “We’re not seeing a clean turn yet — just a stock trying to stand up while the trend is still leaning against it.”
Summary Data PEP
| Last price | 135.65 USD |
| Change 1 day / 5 days / 1 month | 0.48% / 0.18% / -4.51% |
| Trend / MA-cross | downtrend / none |
| SMA20 / SMA50 | 139.03 / 142.91 |
| RSI (14) / Stochastic %K | 41.3 / 11.3 |
| Bollinger %B / ATR | 23% / 3.70 |
| Support / Resistance 20 days | 135.00 / 144.98 |
| Data as of | 22 Juli 2026 20:30 WIB |


