Singtel Stock Analysis: Gains 0.91%, Testing Key Resistance
On Juli 23, 2026: price 4.44 SGD, trend sideways, RSI 50.1, support 4.37, resistance 4.47. technical analysis of singtel stock. Singtel Stock Analysis — full…

Singapore Telecom’s shares on SGX edged up to 4.44 SGD on 21 July 2026, rising from 4.40 as the stock stayed inside a tight trading band and hovered just above its short-term average. The move matters less for its size than for what it says about positioning: Singtel is not trending strongly, but it is also not losing support, and the latest tape shows buyers still willing to step in near the middle of the recent range.
Trend & Price Action
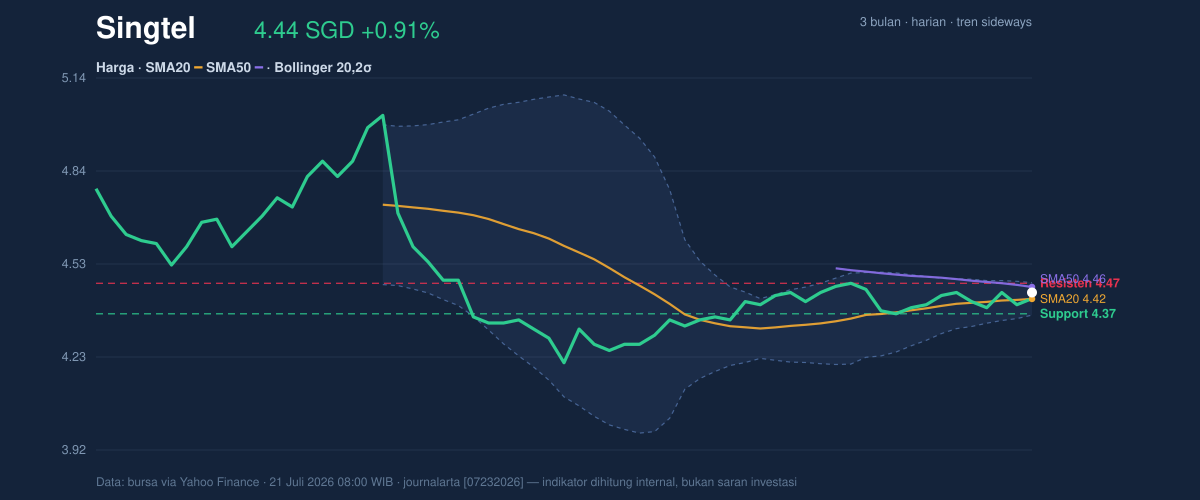
As shown in the chart, Singtel is still in a sideways pattern, with the SMA20 at 4.42 and the SMA50 at 4.46. Price sitting above the SMA20 but below the SMA50 is a classic sign of a market that has stabilised in the short term without yet proving a broader uptrend. In plain terms, the stock has stopped falling, but it has not yet convinced the market that it can reclaim the longer average that often acts like a ceiling.
The SMA20 slope of 0.36% over 5 days points to a mild upward tilt, which is enough to show short-term repair but not enough to call a decisive trend change. There is also no new MA-cross, meaning the moving averages have not delivered a fresh bullish or bearish signal. That usually leaves traders watching price behaviour around the averages themselves, because the averages are now acting more as reference points than as active trend triggers.
The stock’s location within the recent band also matters. With 20-hour support at 4.37 and 20-hour resistance at 4.47, the latest close is sitting in the upper part of the range, about 70% of the way up. That placement suggests the market has enough strength to avoid the lower boundary for now, but not enough momentum to force a clean breakout on its own.
Oscillators & Momentum
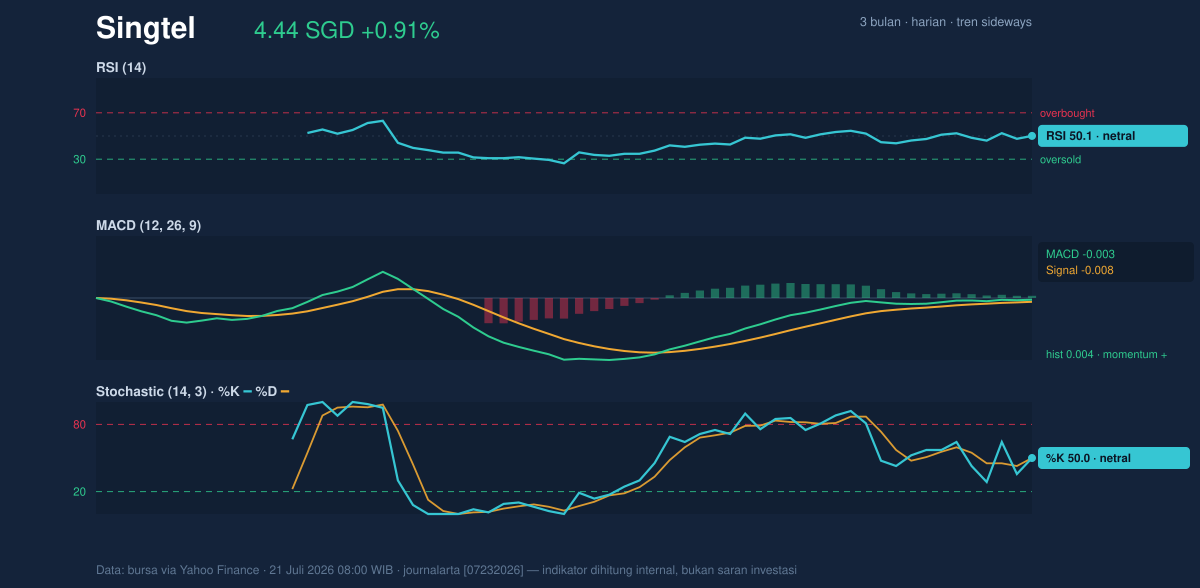
The momentum picture is balanced rather than decisive, as shown in the chart. The RSI(14) at 50.1 is essentially neutral, which means neither buyers nor sellers are in clear control. That is important because RSI around the midpoint often appears when a stock is pausing after a move, not when it is building a strong directional impulse.
The Stochastic %K at 50.0 and %D at 50.0 reinforce that same reading. Stochastic measures where the close sits relative to the recent high-low band, so a midpoint reading says the stock is neither stretched nor washed out. In other words, Singtel is not overbought, but it is not oversold enough to imply an immediate rebound signal either.
The one constructive detail is the MACD at -0.003, with the signal line at -0.008 and a histogram of 0.004. MACD below zero still says the broader momentum backdrop is not fully bullish, but the positive histogram shows the faster line has moved above the signal line. That is a subtle improvement, and it helps explain why the stock can hold above short-term support even while the trend remains sideways.
Volatility & Volume
Volatility is contained but not asleep. The Bollinger upper band at 4.47, middle band at 4.42, and lower band at 4.37 form a narrow corridor, and the 2.4% band width indicates a squeeze. A squeeze often means the market is compressing energy rather than resolving it, so the next meaningful move may be larger than the recent day-to-day drift. The key point is that compression does not predict direction; it only says the stock is storing pressure.
The %B at 70% shows price is leaning toward the upper half of the band, which is a modestly constructive sign because it places the stock closer to resistance than support. Still, it is not close enough to the top band to signal an overheated condition. That leaves room for either continuation or another stall.
Volume adds a more encouraging layer. The latest turnover of 37,180,200 was about 1.4× normal versus the 20-hour average of 26,932,900, while OBV is rising. Rising on-balance volume means more volume has been associated with up moves than down moves, which often suggests accumulation rather than distribution. In practical terms, the market is participating in the advance instead of merely drifting higher on thin trade.
ATR(14) at 0.07, or 1.5% of price, points to moderate day-to-day movement. That is consistent with the narrow Bollinger structure: the stock is moving, but not violently, which makes the current range more important because breaks from compressed ranges can matter more than the recent quiet.
Key Levels & Scenarios
The nearest technical map is clear. 4.47 is the immediate resistance from the 20-hour range and also the upper Bollinger band, so it is the first level that must be cleared to shift the tone from range trade to breakout attempt. On the downside, 4.37 is the first support, matching the lower Bollinger band and the lower edge of the recent trading band. Below that, the broader 3-month low at 4.15 becomes the deeper reference point for the current structure.
The stock is also trading well below the 3-month high of 5.05, which shows there is still a lot of historical room above, but the market has not yet reclaimed that territory. For now, the more relevant question is whether Singtel can close above 4.47 with volume, because that would confirm the squeeze is resolving upward. If it fails to hold 4.37, the recent base starts to weaken and the market may revisit the lower part of the broader range.
Technical Verdict: HOLD (wait & see)
HOLD (wait & see) is the clearest reading from the current setup.
- RSI at 50.1 and Stochastic at 50.0/50.0 are neutral, so momentum is not strong enough to justify a directional call.
- MACD histogram at 0.004 is positive, but the MACD line remains below zero, which means improvement is present but not yet decisive.
- The Bollinger squeeze and price above SMA20 suggest a possible expansion, but price below SMA50 keeps the larger trend unconfirmed.
- Ideal Entry Range: 4.37 to 4.42
- Exit Target: 4.47
- Stop Loss Protection: below 4.37
Verdict invalidated if price breaks below 4.37.
For non-traders, this means the stock is stable enough to watch closely, but not yet strong enough to call a clean trend.
Summary Data Singtel
| Last price | 4.44 SGD |
| Change 1 day / 5 days / 1 month | 0.91% / 0.00% / 2.07% |
| Trend / MA-cross | sideways / none |
| SMA20 / SMA50 | 4.42 / 4.46 |
| RSI (14) / Stochastic %K | 50.1 / 50.0 |
| Bollinger %B / ATR | 70% / 0.07 |
| Support / Resistance 20 days | 4.37 / 4.47 |
| Data as of | 21 Juli 2026 08:00 WIB |


