XOM Stock Analysis: Gains 1.81%, Testing Key Resistance
On Juli 23, 2026: price 154.45 USD, trend sideways, RSI 69.5, support 136.06, resistance 154.45. technical analysis of xom stock. XOM Stock Analysis — full…

ExxonMobil climbed to 154.45 USD on the NYSE, up 1.81% on the day and 10.53% over the past month, as the stock pushed to the top of its recent trading range, according to Yahoo Finance data cited at 22 July 2026 20:30 WIB. The move matters because it is not just a one-day pop: XOM is now trading above both its short- and medium-term moving averages, which usually signals that buyers have regained control, but the advance is also running into technical stretch marks that can limit how far momentum can travel without a pause.
Trend & Price Action
The chart shows a stock that has shifted from hesitation to strength, but not into a clean new trend yet. XOM sits above its SMA20 at 141.73 and SMA50 at 146.29, which is constructive because it means the price is holding above the average cost basis of recent and intermediate buyers. The SMA20 slope of 1.77% over five days suggests the short-term trend is still rising, yet the broader label remains sideways, a reminder that the move is an advance inside a range rather than a confirmed breakout regime.
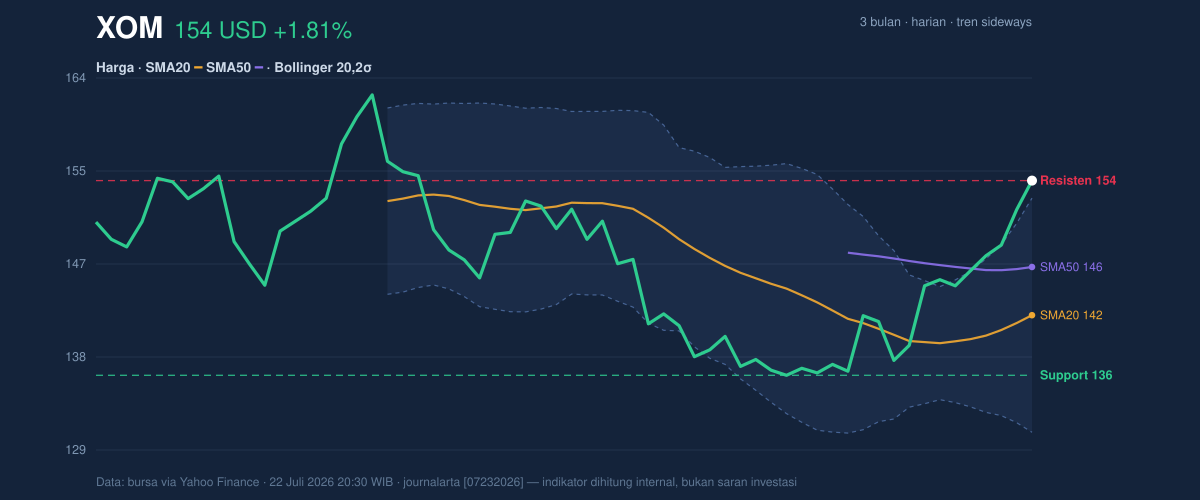
That distinction matters. The stock is now at 100% of its 20-hour range, with support at 136.06 and resistance at 154.45, which means price has already reached the upper boundary of the recent band. It is also close to the 3-month high of 163.68, leaving less room before the next visible ceiling and increasing the chance that traders who bought earlier may start taking profits. At the same time, the 3-month low of 134.95 remains well below current levels, showing that the market has repaired a meaningful part of the prior drawdown.
Oscillators & Momentum
The momentum picture is stronger than the trend label alone would suggest, but it is also showing signs of overheating. The RSI at 69.5 is described in the data as neutral, yet it is sitting very close to the traditional overbought zone, which means upside pressure is still present but the stock is no longer early in the move. More important is the Stochastic %K at 98.1 and %D at 95.5, which is plainly overbought; that tells readers the stock is closing near the top of its recent range and may be vulnerable to a pause if fresh buyers do not keep arriving.
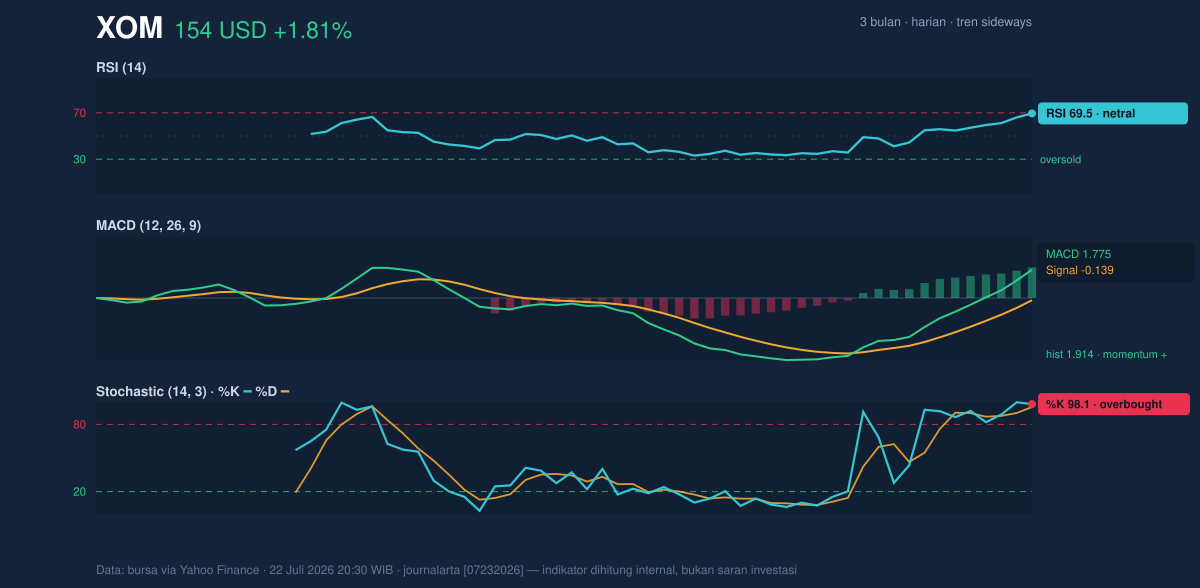
The MACD at 1.775, with the signal line at -0.139 and a histogram of 1.914, is the clearest evidence that upside momentum is still positive. In plain English, MACD measures whether the shorter-term trend is outrunning the longer-term trend, and here it is doing so decisively. The catch is that strong momentum and overbought oscillators often coexist near short-term peaks; that combination usually means trend strength is real, but timing risk is rising.
Volatility & Volume
Volatility is present, but not extreme. The ATR(14) of 3.34, equal to 2.2% of price, points to moderate volatility, so daily swings are large enough to matter without implying disorderly trading. The Bollinger Bands add another layer: price is above the upper band at 152.80, with %B at 107%, which means XOM is trading beyond the normal statistical envelope used by many traders to judge stretch. That does not automatically mean reversal, but it does signal that the stock has moved faster than its recent average pace and may need either consolidation or a fresh catalyst to keep extending.
The band width at 15.6% is described as normal, so this is not a compression setup waiting for a volatility explosion. Instead, the market is already in motion, and the question is whether participation can stay strong enough to justify price trading outside the upper band. Volume argues for caution on that front: the latest print of 13,773,500 was only 0.9x the 20-hour average of 15,484,995. That means the breakout-style move is not yet backed by unusually heavy turnover, even though OBV is rising, which shows cumulative volume flow still favors buyers.
Key Levels & Scenarios
The immediate map is tight and important. 154.45 is both the latest price and the current resistance marker, so the stock is literally sitting on the level that needs to be cleared for further extension. If XOM can hold above that area, the next reference point is the 3-month high of 163.68, which becomes the obvious upside magnet on the chart. If it fails to stay above the current high zone, the first meaningful area to watch is 136.06, where prior support should reveal whether the recent rally was durable or simply a fast move inside a sideways structure.
The technical message is therefore mixed but not weak: price strength, rising short-term slope, positive MACD, and improving OBV all point in the same direction, while overbought Stochastic readings, a position above the upper Bollinger band, and only normal volume warn that the move is extended. In other words, XOM is strong, but the chart says it is already close to the point where strength has to prove itself again.
Technical Verdict: HOLD (wait & see)
- Why: MACD is positive and still supportive of upside momentum.
- Why: Price is above SMA20 and SMA50, which keeps the short-term structure constructive.
- Why: Stochastic is overbought and price is above the upper Bollinger band, so the setup is extended rather than fresh.
- Invalidation: this verdict is invalidated if price falls below 136.06.
- Ideal Entry Range: 141.73 to 146.29
- Exit Target: 163.68
- Stop Loss: 136.06
For non-traders, this means the stock looks healthy, but it is already stretched enough that the next move matters more than the last one.
Summary Data XOM
| Last price | 154.45 USD |
| Change 1 day / 5 days / 1 month | 1.81% / 6.88% / 10.53% |
| Trend / MA-cross | sideways / none |
| SMA20 / SMA50 | 141.73 / 146.29 |
| RSI (14) / Stochastic %K | 69.5 / 98.1 |
| Bollinger %B / ATR | 107% / 3.34 |
| Support / Resistance 20 days | 136.06 / 154.45 |
| Data as of | 22 Juli 2026 20:30 WIB |


