Alibaba Stock Gains 2.42%, Momentum Weakens In Focus
On September 7, 2026: price 110.10 HKD, trend sideways, RSI 41.0, support 107.50, resistance 126.70. technical analysis of alibaba stock.
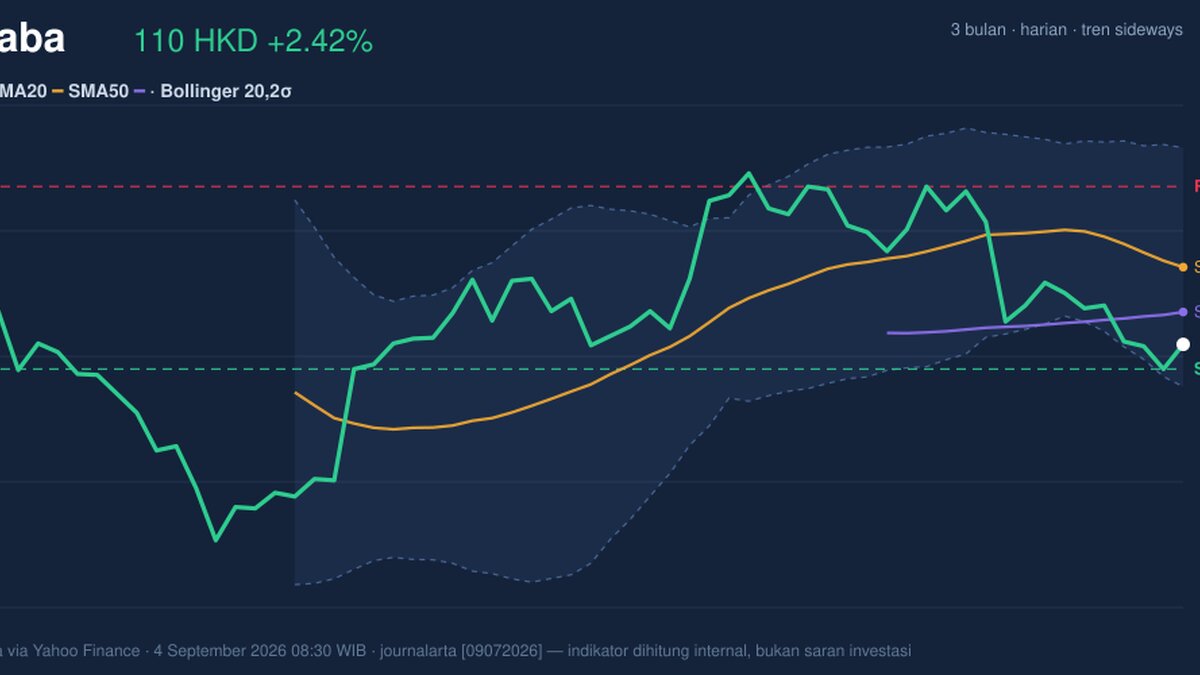
Alibaba Group’s Hong Kong-listed shares rose to HKD 110.10 on Thursday, recovering from the previous close of HKD 107.50, but the bounce still leaves the stock below its short- and medium-term trend lines, according to data from Yahoo Finance via the Hong Kong exchange at 08:30 WIB on 4 September 2026.
The move matters because it comes after a month in which the shares fell 11.07%, a sign that the latest uptick is better read as a test of support than a confirmed trend change. In plain terms: the stock is trying to stabilise, but the broader chart still leans cautious.
Trend & Price Action
As shown in the chart, Alibaba’s Hong Kong line remains in a sideways trend, but that label masks a more important detail: the SMA20 at HKD 118.23 is falling, with a -3.08% slope over five days, and the share price is still below the SMA20 as well as the SMA50 at HKD 113.51. That positioning tells traders the recent rebound has not yet reclaimed the short-term structure that would normally signal improving momentum. There is also no fresh MA-cross, meaning there is no new moving-average confirmation of a trend shift.
The stock is now trading near the lower half of its recent range, with the 20-hour support at HKD 107.50 and resistance at HKD 126.70. At 14% of that range, the price is still much closer to support than resistance, which usually implies the market is testing whether sellers are exhausting rather than launching a durable breakout.
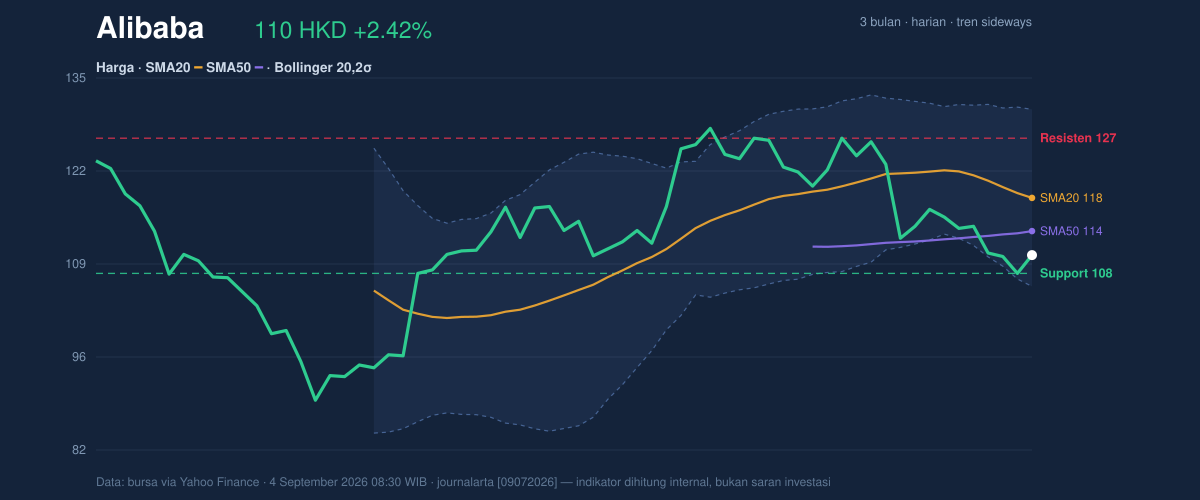
A key detail is the broader three-month frame: the share has moved between HKD 130.30 and HKD 88.65. That wide span shows the market has already priced in a meaningful amount of uncertainty, but it also means rallies can stall quickly unless buyers reclaim the moving averages first.
Oscillators & Momentum
The momentum picture is mixed, and that mix is exactly what makes the next few sessions important. RSI(14) at 41.0 is still neutral, not oversold, which suggests the stock is not yet at an extreme where a rebound would be technically “washed out.” By contrast, the Stochastic %K at 15.5 and %D at 10.4 are in oversold territory, a sign that short-term selling pressure has been heavy enough to push the stock into a stretched zone.
That oversold reading does not automatically mean a reversal; it simply means the stock is vulnerable to a bounce if selling eases. The stronger caution comes from MACD at -2.069, with the signal at -0.456 and the histogram at -1.613. In practical terms, MACD is still below its signal line and the negative histogram shows downside momentum remains in force. So while the stochastic is hinting at short-term exhaustion, MACD says the broader push is still negative.
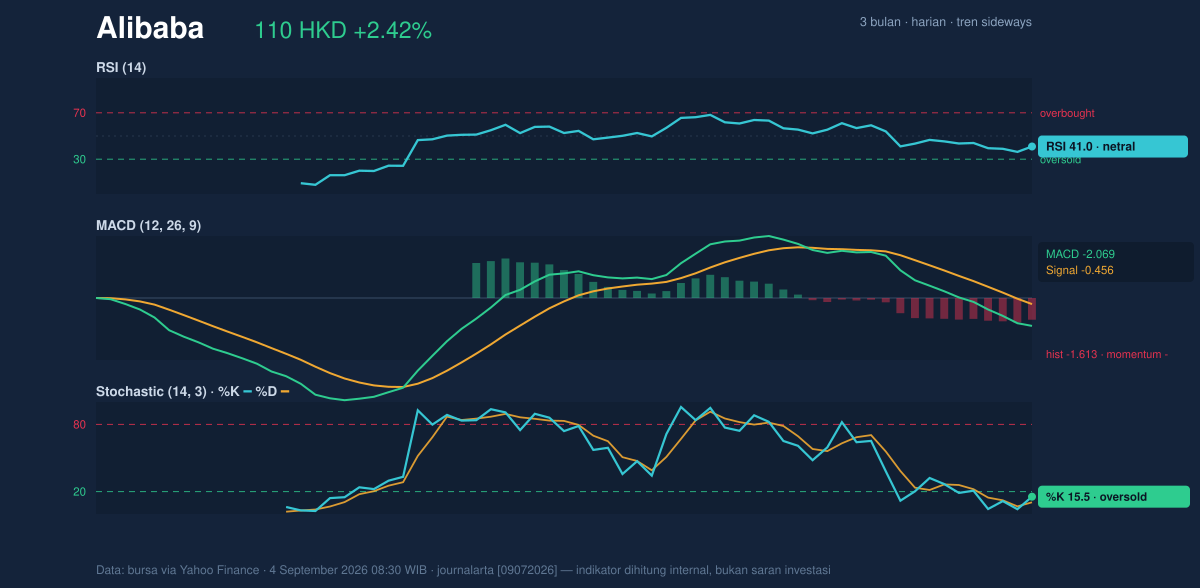
That split between oversold stochastic and negative MACD often appears when a stock is near a tactical floor but not yet ready to reverse with conviction.
Volatility & Volume
Volatility is elevated. The Bollinger Band width at 21.3% is expanding, and ATR(14) at 4.84 equals 4.4% of the share price, which means daily swings are large enough that intraday moves can look dramatic without changing the bigger picture. The price sits with %B at 18%, close to the lower band at HKD 105.67, which signals the stock is trading near the bottom of its volatility envelope. That is often where pressure can ease, but it can also be where breakdowns accelerate if support gives way.
Volume offers only limited confirmation. Last trade volume of 103,698,738 is roughly 1.0× normal versus the 20-hour average of 99,829,491, so the rebound did not arrive with a decisive surge in participation. More importantly, OBV is falling, which indicates that the balance of volume has still been favouring distribution rather than accumulation. In simple language: traders have been active, but the flow of money has not yet turned decisively positive.
Key Levels & Scenarios
The chart’s immediate technical map is clear. HKD 107.50 is the first line to watch on the downside, because it matches the 20-hour support and sits just above the lower Bollinger band at HKD 105.67. If that area fails, the market would be opening the door to a retest of the lower volatility boundary and potentially the broader three-month low zone.
On the upside, HKD 113.51 is the first recovery checkpoint because it is the SMA50. Above that, HKD 118.23 is more important still, since it marks the SMA20 and the Bollinger middle band. Reclaiming that level would show the stock is not just bouncing, but moving back into the heart of its recent trading range. Beyond that, HKD 126.70 becomes the resistance band that would need to be cleared before the chart would begin to look structurally stronger.
Technical Verdict: HOLD (wait & see)
HOLD (wait & see)
- MACD remains negative, so the broader momentum trend has not yet turned up.
- Price is below both SMA20 and SMA50, which keeps the stock beneath its short- and medium-term trend markers.
- Stochastic is oversold and %B is near the lower band, which argues for caution against chasing weakness and leaves room for a tactical rebound.
Verdict invalidated if price falls below HKD 105.67.
- Ideal Entry Range: HKD 107.50 to 113.51
- Exit Target: HKD 118.23, then HKD 126.70
- Stop Loss protection: below HKD 105.67
For non-traders: the chart says Alibaba’s Hong Kong shares are trying to steady, but they have not yet proved that the downtrend has ended.
HKD 105.67 is the lower Bollinger band.
Summary Data Alibaba
| Last price | 110.10 HKD |
| Change 1 day / 5 days / 1 month | 2.42% / -3.34% / -11.07% |
| Trend / MA-cross | sideways / none |
| SMA20 / SMA50 | 118.23 / 113.51 |
| RSI (14) / Stochastic %K | 41.0 / 15.5 |
| Bollinger %B / ATR | 18% / 4.84 |
| Support / Resistance 20 days | 107.50 / 126.70 |
| Data as of | 4 September 2026 08:30 WIB |
Track Alibaba share price daily: live levels, support/resistance and our full Alibaba analysis history.