UOB Stock Analysis: Gains 0.65%, Momentum Gains
On September 7, 2026: price 42.01 SGD, trend sideways, RSI 54.7, support 40.22, resistance 43.30. technical analysis of uob stock. UOB Stock Analysis — full…
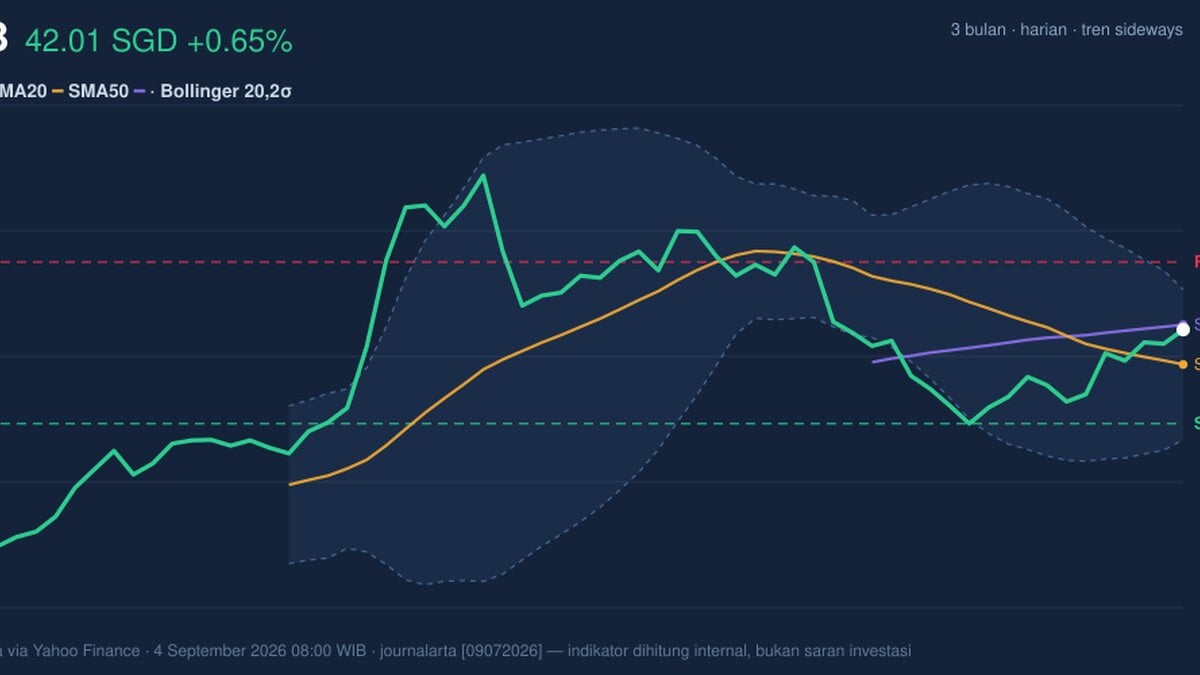
UOB ended at SGD 42.01 on SGX, edging up 0.65% from the previous close of 41.74 as the counter tried to stabilise inside a broader sideways pattern. The move matters less for its size than for what it says about positioning: the stock is trading above its 20-day average at 41.35 but still just below its 50-day average at 42.11, a setup that often signals a market that is repairing, not yet fully confirming a trend change.
Trend & Price Action
The chart shows UOB sitting in the middle of its recent range, at 58% of the 20-day band, which is usually a neutral-to-firm location rather than an overheated one. The broader trend remains sideways, and the SMA20 slope of -0.94% over 5 days suggests the short-term drift is still a little soft even though price has recovered above that line. That combination is important: when price is above the shorter average but the slope is still negative, the market is often in a tentative rebound phase rather than a clean uptrend.
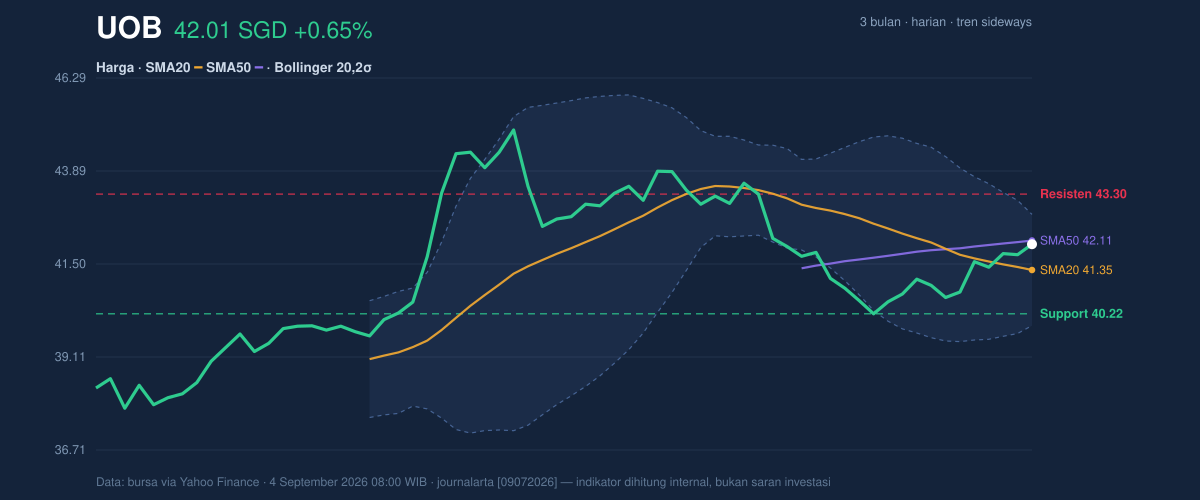
The nearest technical floor is SGD 40.22, while the first ceiling sits at SGD 43.30. With the stock also trading below the SMA50 at 42.11, the 50-day line becomes a practical pivot; a sustained move through it would tell traders that recent buying is starting to outweigh the weaker month-long tone. The stock is still below its 3-month high of 45.15 and above its 3-month low of 37.52, so it remains in the upper half of its wider range without yet reclaiming the earlier peak.
Oscillators & Momentum
Momentum is mixed, and that is the key signal in the chart. The RSI at 54.7 is neutral, which means the stock is neither stretched on the downside nor showing strong trend exhaustion. By contrast, the Stochastic %K at 84.0 and %D at 90.6 are in overbought territory, suggesting the recent bounce may be running ahead of itself in the very short term.
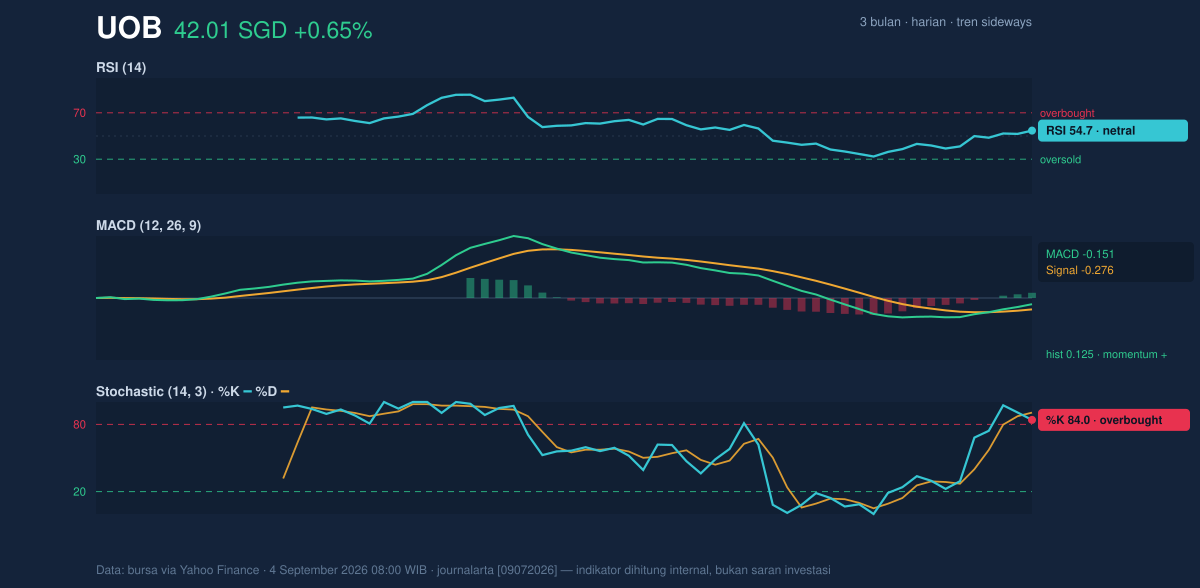
That divergence matters because stochastic oscillators move faster than RSI. When stochastic is elevated while RSI is only neutral, it often means upside momentum exists, but it may be vulnerable to a pause or pullback before a more durable advance can form. The MACD at -0.151, however, is still below zero while sitting above its signal line at -0.276, leaving a positive histogram of 0.125. In plain language, that says downside momentum has eased and the short-term trend is improving, even if the broader signal has not turned fully bullish yet.
Volatility & Volume
Volatility is subdued. The ATR of 0.53, or 1.3% of price, points to a calm trading environment where daily swings have been relatively contained. That usually supports a gradual grind rather than a sharp trend day, but the Bollinger Bands are telling a more interesting story: the 6.9% band width is narrowing, which is a classic squeeze signal and often precedes a breakout in either direction.
At the same time, price is sitting at %B 73%, meaning it is in the upper portion of the Bollinger envelope but not yet pressing against the upper band at 42.78. That placement suggests buyers have regained some control, though not enough to claim full upside momentum. Volume adds a useful check. The latest turnover of 2,870,500 shares was only 0.8x normal versus the 20-day average of 3,706,105, so the bounce has not yet been backed by strong participation. Still, OBV is rising, which indicates the cumulative flow of volume has been improving even if the latest session itself was not especially heavy. In chart terms, that is a mild confirmation signal rather than a decisive one.
Key Levels & Scenarios
The immediate map is clear. A hold above SGD 41.35 keeps price above the short-term average and preserves the rebound structure. A push through SGD 42.11 would bring the 50-day line into play as a more credible test of trend repair. From there, SGD 42.78 marks the upper Bollinger band, and SGD 43.30 is the first hard resistance from recent trading.
If price fails to hold SGD 40.22, the chart would lose the current support base and likely expose the lower Bollinger band at 39.92. That would be a more serious sign that the rebound has stalled. For now, the technical picture is one of cautious improvement rather than broad confirmation: price is recovering, momentum is better, but participation is light and the short-term oscillator is already stretched.
Technical Verdict: HOLD (wait & see)
HOLD (wait & see)
- Reason 1: Price is above SMA20 at 41.35, and MACD is positive versus its signal line, showing short-term improvement.
- Reason 2: Stochastic is overbought while RSI is only neutral, which suggests upside is not yet cleanly confirmed.
- Reason 3: Bollinger Bands are squeezing and volume is below average, so the next move may need stronger participation to validate direction.
- Verdict invalidated if price breaks below 40.22, because that would mean the current support base has failed.
- Ideal Entry Range: SGD 41.35 to SGD 42.11
- Exit Target: SGD 42.78 to SGD 43.30
- Stop Loss protection: below SGD 40.22
In plain English, UOB looks like a stock that is trying to turn firmer, but it has not yet proven that the rebound can last. The next visible test is whether it can stay above SGD 41.35 and then challenge SGD 42.11, with the next scheduled reference coming from the market’s response around SGD 43.30.
Summary Data UOB
| Last price | 42.01 SGD |
| Change 1 day / 5 days / 1 month | 0.65% / 3.02% / -3.60% |
| Trend / MA-cross | sideways / none |
| SMA20 / SMA50 | 41.35 / 42.11 |
| RSI (14) / Stochastic %K | 54.7 / 84.0 |
| Bollinger %B / ATR | 73% / 0.53 |
| Support / Resistance 20 days | 40.22 / 43.30 |
| Data as of | 4 September 2026 08:00 WIB |
Track UOB share price daily: live levels, support/resistance and our full UOB analysis history.