AstraZeneca Stock Analysis: Gains 1.57%, Death Cross Pressure
On Juli 24, 2026: price 12,688.00 GBp, trend downtrend, RSI 40.5, support 12,364.00, resistance 14,538.00. technical analysis of astrazeneca stock.

At 14:00 WIB on 22 July 2026, AstraZeneca’s LSE shares were quoted at 12,688.00 GBp, up 1.57% on the day from a 12,492.00 previous close, according to Yahoo Finance data via the exchange. The move is modest in isolation, but the chart still sits inside a broader corrective phase: the price remains below both short- and medium-term averages, the trend is down, and the latest bounce has not yet changed the underlying structure.
Trend & Price Action
The most important signal is not the day’s gain, but where it happened. AstraZeneca is trading below its SMA20 at 13,442.70 and SMA50 at 13,546.20, which means the share price is still below the recent average and the intermediate trend line. In practical terms, that usually tells investors that rallies are being sold before they can re-establish control.
The death cross — where the 20-day average has moved under the 50-day average — reinforces that message. It is a lagging signal, but it often appears when a stock has already lost directional momentum and needs time to rebuild. The SMA20 slope of -1.60% over 5 days shows the shorter trend is still pointing lower, so the recent uptick looks more like a pause inside a downtrend than a confirmed reversal.
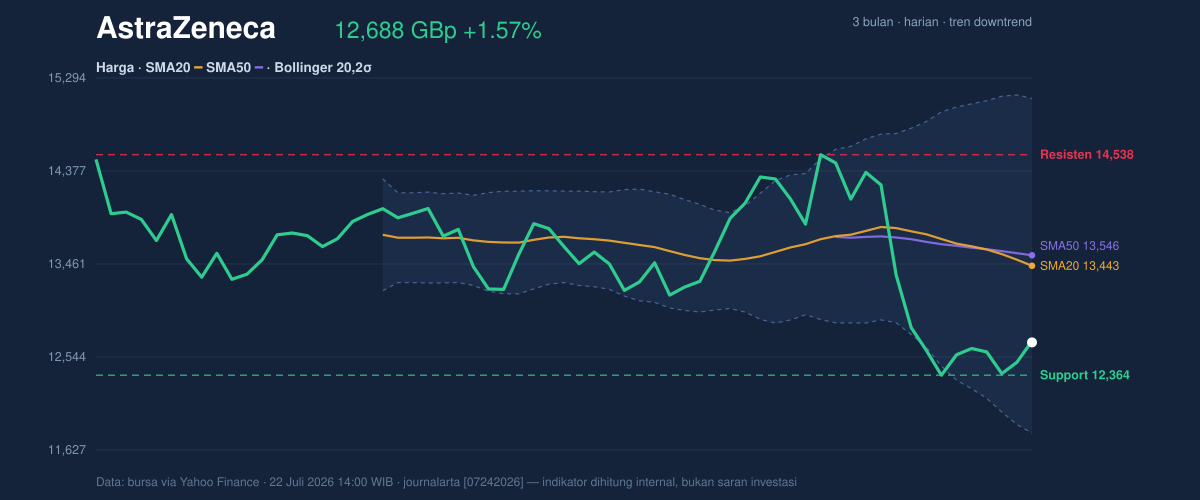
Position within the range matters as well. The stock is trading above the 20-day support at 12,364.00 and below the 20-day resistance at 14,538.00, placing it in the lower part of that band, roughly 15% up from the floor. That location matters because price near support can attract dip buyers, but only if the support starts to hold on repeated tests. The broader three-month range — 15,126.00 high versus 9,892.00 low — shows there is still room for the share to fluctuate sharply in either direction, but the market has not yet reclaimed the upper half of that range.
Oscillators & Momentum
Momentum is mixed rather than constructive. The RSI(14) at 40.5 is technically neutral, but it sits closer to the weak side of the scale, which suggests the stock has not yet regained enough buying pressure to shift into a stronger recovery phase. The Stochastic %K at 60.1 and %D at 55.4 are also neutral, indicating the recent bounce has improved short-term positioning without creating an overbought condition. In other words, the stock has some room to rise, but it has not yet proved that buyers are in firm control.
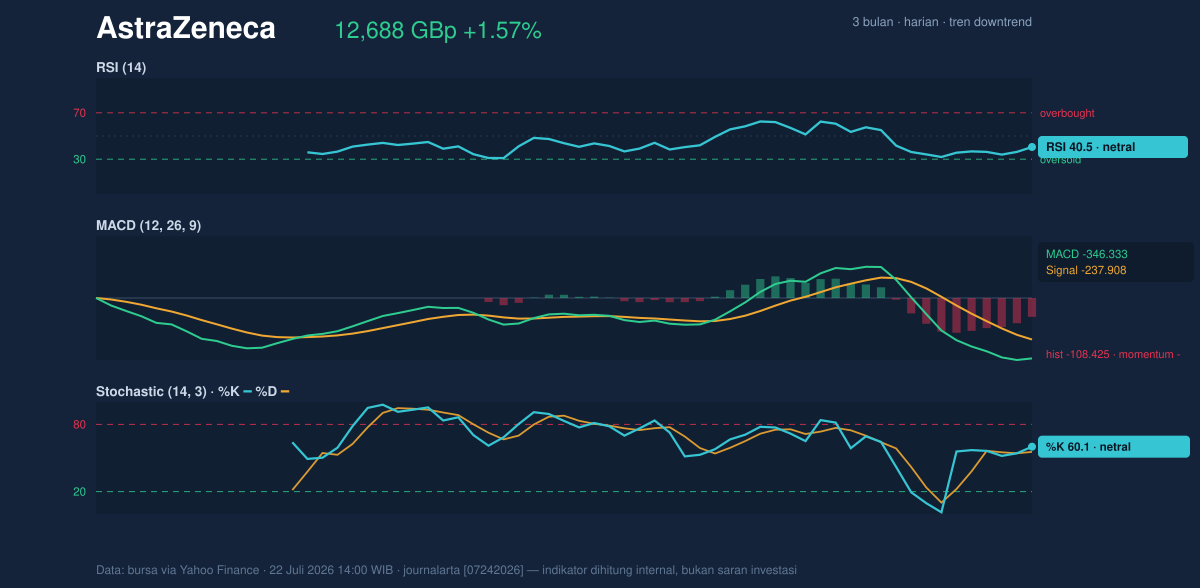
The clearest warning comes from MACD. The MACD at -346.333, below the signal line at -237.908, with a histogram of -108.425, shows downside momentum still dominates. For general readers, that means the trend-following indicator is not confirming the price bounce; instead, it says the recent lift is happening while the broader momentum remains negative. That combination often produces choppy trading unless price can push decisively back above the moving averages.
Volatility & Volume
Volatility is elevated. The Bollinger Band range is wide, with the upper band at 15,091.65, the middle band at 13,442.70, and the lower band at 11,793.75. The %B at 27% places the share in the lower portion of the band structure, which means price is closer to the lower band than the upper band and still lacks upward pressure. The 24.5% band width signals expansion rather than compression, so the market is not coiling quietly; it is already in a more active, unstable phase.
That is echoed by the ATR(14) at 771.86, equal to 6.1% of price. ATR measures typical daily movement, so a reading like this implies the shares can travel a meaningful distance in a session. For traders and long-only holders alike, that matters because support and resistance can be tested quickly, and overshoots are more likely when volatility is high.
Volume does not yet provide a strong confirmatory signal. Last volume was 2,497,217, almost exactly in line with the 2,520,435 20-hour average, or 1.0× normal. That means the latest bounce is not being driven by an obvious surge in participation. The OBV is falling, which is more important: on-balance volume tracks whether money is flowing in or out over time, and a declining line suggests selling pressure has still outweighed accumulation even when the price occasionally lifts.
Key Levels & Scenarios
The nearest level to watch is 12,364.00. If the share price continues to hold above that support, the market can attempt a recovery toward 13,442.70, where the SMA20 and Bollinger midline converge, and then toward 13,546.20, the SMA50. That area is important because it is where a weak bounce becomes a more credible trend repair.
If price fails to hold 12,364.00, the next reference is the lower Bollinger band at 11,793.75. A break there would signal that the market is not just drifting lower, but is also moving beyond the recent support structure that has contained the decline. On the upside, a move through 14,538.00 would begin to challenge the current bearish setup, though the chart would still need to clear the moving averages and improve momentum to change the broader picture.
Technical Verdict: HOLD (wait & see)
HOLD (wait & see) fits best because the price is still below the SMA20 and SMA50, the chart is in a death cross, and MACD remains negative. At the same time, RSI and Stochastic are neutral rather than oversold, so there is no strong technical exhaustion signal yet. The latest bounce is real, but it has not been confirmed by volume or by a momentum turn.
- Ideal entry range: 12,364.00 to 13,442.70, with the lower end anchored to support and the upper end to the SMA20/Bollinger midline.
- Exit target: 13,546.20 to 14,538.00, using the SMA50 and resistance zone as the first technical objectives.
- Stop loss protection: below 11,793.75, the lower Bollinger band and the next clear downside reference.
- Verdict invalidated if: price breaks and holds below 12,364.00.
Summary Data AstraZeneca
| Last price | 12,688.00 GBp |
| Change 1 day / 5 days / 1 month | 1.57% / 0.97% / -8.79% |
| Trend / MA-cross | downtrend / death |
| SMA20 / SMA50 | 13,442.70 / 13,546.20 |
| RSI (14) / Stochastic %K | 40.5 / 60.1 |
| Bollinger %B / ATR | 27% / 771.86 |
| Support / Resistance 20 days | 12,364.00 / 14,538.00 |
| Data as of | 22 Juli 2026 14:00 WIB |


