HSBC Stock Technicals Today: Gains 1.06%, Testing Key Resistance
On September 7, 2026: price 1,580.20 GBp, trend sideways, RSI 64.9, support 1,497.20, resistance 1,580.20. technical analysis of hsbc stock.
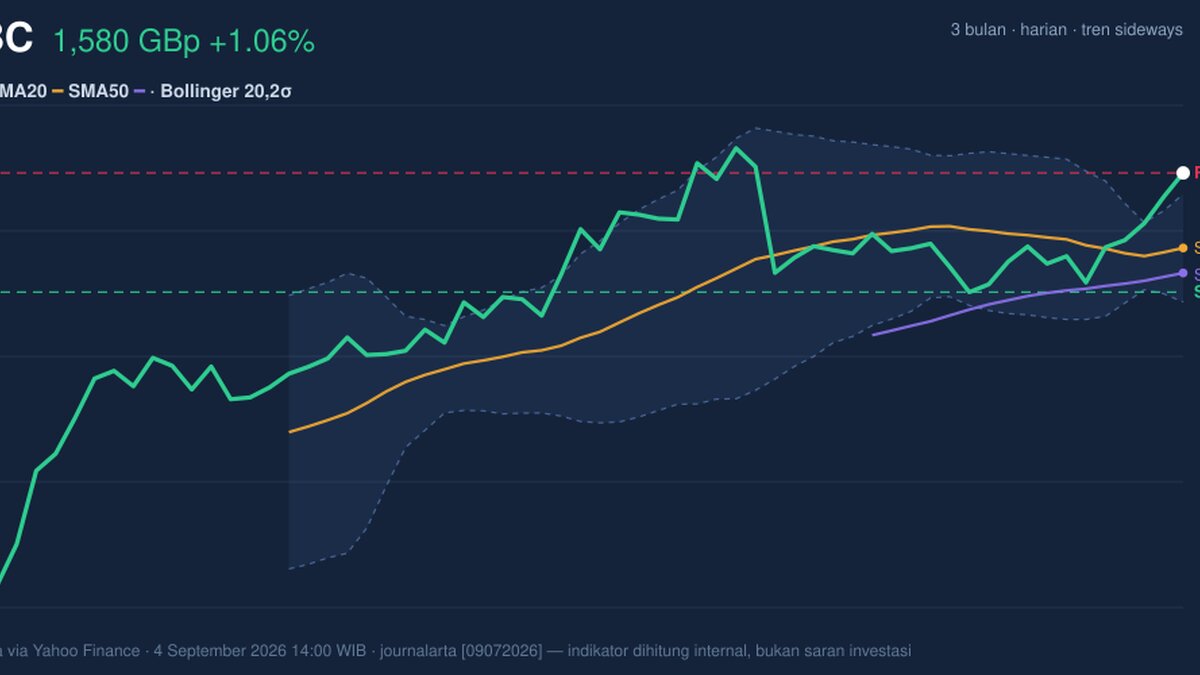
HSBC Holdings’ LSE-listed shares rose to 1,580.20 GBp on 4 September 2026 at 14:00 WIB, up 1.06% on the day and extending gains to 5.07% over five days. The move puts the stock at the top of its recent trading band, with the chart showing price pressing into fresh short-term resistance even as the broader trend remains only sideways. That combination matters: it suggests buyers are still in control for now, but they are also running into a level where momentum often gets tested.
Trend & Price Action
As shown in the chart, HSBC is trading above SMA20 at 1,527.90 and above SMA50 at 1,510.50, which is a constructive short-term setup even though the stated trend is still sideways. In plain terms, the share price is sitting above the recent average and the medium-term average, but the averages themselves are not yet pointing to a clean directional breakout. The slope of SMA20 at -0.13% over five days says the trend has not fully turned upward; it is more a case of price outrunning a flat-to-soft moving-average base.
The stock is also trading at 100% of its 20-hour range, with support at 1,497.20 and resistance at 1,580.20. That is important because the current price is effectively sitting on resistance rather than just approaching it. When a share reaches the top of its range, the next move tends to depend on whether buyers can force a close above that ceiling or whether the market pauses to digest recent gains.
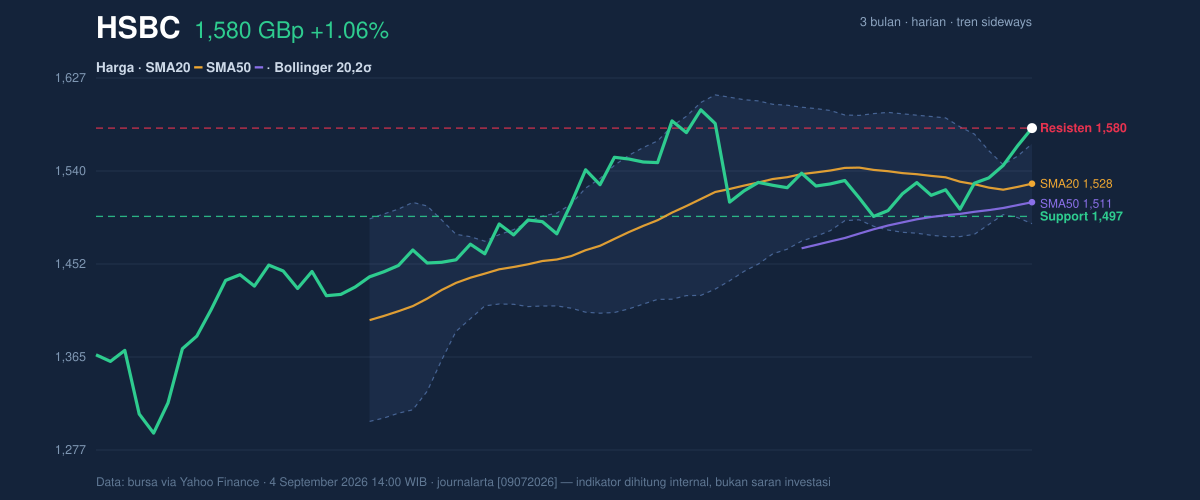
The broader backdrop is still manageable. HSBC is below its 3-month high of 1,610.00 but well above the 3-month low of 1,267.20, which places the stock in the upper half of its recent range without yet confirming a full trend shift. That is a classic “testing the top of the box” profile.
Oscillators & Momentum
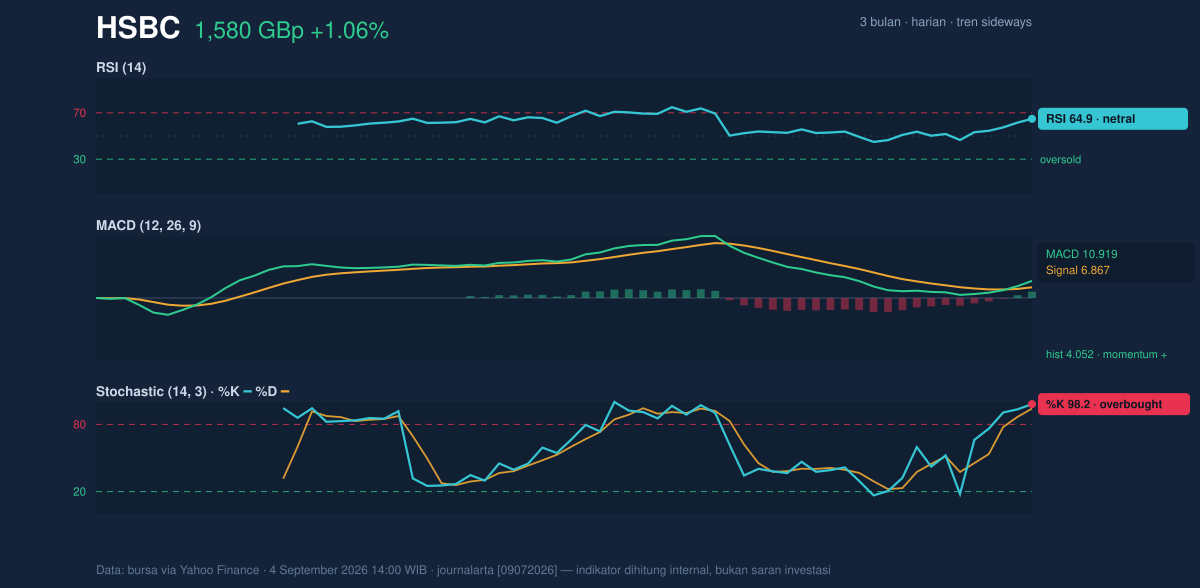
Momentum indicators are mixed, and that mix is the key signal. RSI at 64.9 is still technically neutral, but it is approaching the zone where rallies begin to look stretched. RSI measures the speed of gains versus losses; at this level, it says the stock is firm, but not yet in a classic overbought warning area. By contrast, the Stochastic %K at 98.2 and %D at 94.1 are clearly overbought, meaning the latest price action has been very strong relative to its recent range. That often appears near short-term peaks, though it does not automatically mean reversal; in strong moves, Stochastic can stay elevated for a while.
The more convincing part of the momentum picture is the MACD at 10.919, above its signal line at 6.867, with a histogram of 4.052. MACD compares faster and slower price trends; when it sits above the signal line and the histogram is positive, it indicates upward momentum is still intact. In other words, the stock is not just drifting higher — it is doing so with trend confirmation. The tension is that this strength is now colliding with overbought short-term oscillators.
That makes the next move less about direction and more about follow-through.
Volatility & Volume
The Bollinger setup adds another layer. HSBC’s %B at 120% shows price has moved above the upper band, which is a sign of strong short-term extension. The upper band sits at 1,565.43, so the stock is already trading beyond the envelope that normally contains most recent moves. At the same time, the Bollinger band width of 4.9% is narrowing, signaling a squeeze. A squeeze often means volatility has compressed and a larger move may follow; when that compression happens while price is already near the top band, the market is effectively coiling just under resistance.
The volume picture is less emphatic. Last volume was 15,593,570, below the 20-hour average of 23,958,277, or 0.7× normal. That means the latest rise was not backed by unusually heavy participation. For a breakout attempt, that matters: price can push higher on light volume, but the move is usually more convincing when turnover expands. Still, OBV is rising, which suggests the broader balance of accumulation has remained positive even if the latest session was not especially crowded.
The signal is clear: price is strong, but confirmation is incomplete.
Key Levels & Scenarios
The immediate technical map is straightforward. 1,580.20 is both the latest price and the near-term ceiling. If HSBC can hold above that area, the next reference point is the 3-month high at 1,610.00. If it fails to sustain that push, the first meaningful cushion is 1,527.90 at SMA20, followed by 1,510.50 at SMA50 and then 1,497.20 support.
This is where the chart matters: a stock trading at the top of its range with overbought Stochastic, positive MACD, and a Bollinger squeeze can either break out cleanly or stall and rotate back toward the moving averages. The difference is usually volume and follow-through.
Technical Verdict: HOLD (wait & see)
- Reason 1: MACD is positive and above its signal line, which supports the current upward momentum.
- Reason 2: Price is above SMA20 and SMA50, keeping the short-term structure constructive.
- Reason 3: Stochastic is overbought and price is at 100% of the recent range, so upside is extended and prone to pause.
- Verdict invalidated if price falls below 1,497.20, which would break the stated 20-hour support and weaken the current setup.
- Ideal Entry Range: 1,527.90 to 1,497.20
- Exit Target: 1,610.00
- Stop Loss protection: below 1,497.20
For non-traders: HSBC’s chart is firm, but it is now testing resistance with stretched short-term momentum.
Summary Data HSBC
| Last price | 1,580.20 GBp |
| Change 1 day / 5 days / 1 month | 1.06% / 5.07% / 3.88% |
| Trend / MA-cross | sideways / none |
| SMA20 / SMA50 | 1,527.90 / 1,510.50 |
| RSI (14) / Stochastic %K | 64.9 / 98.2 |
| Bollinger %B / ATR | 120% / 25.77 |
| Support / Resistance 20 days | 1,497.20 / 1,580.20 |
| Data as of | 4 September 2026 14:00 WIB |
Track HSBC share price daily: live levels, support/resistance and our full HSBC analysis history.