Singtel Stock Gains 0.90%, Testing Key Resistance In Focus
On Juli 24, 2026: price 4.46 SGD, trend sideways, RSI 52.8, support 4.37, resistance 4.47. technical analysis of singtel stock. Singtel Stock Gains — full…

Singapore Telecommunications Ltd. edged up to 4.46 SGD on SGX on 22 July 2026, rising from 4.42 as traders pushed the stock back toward the top of its short-term range while volume surged to 1.6× the 20-day average. The move matters because Singtel is not breaking out with force, but it is showing enough participation to suggest buyers are still active near the upper edge of a narrow band. That combination — firm price, heavier turnover, and a market sitting just under nearby resistance — usually signals a stock that is being accumulated cautiously rather than chased aggressively.
Trend & Price Action
The broader structure is still best described as sideways, and that is important because it tells readers the stock is not in a clean trend yet. The SMA20 at 4.42 sits below the last price, while the SMA50 at 4.45 is only slightly beneath it, leaving the share price squeezed between short- and medium-term averages. That narrow positioning often reflects indecision: the market has enough support to avoid slipping, but not enough conviction to launch a sustained advance.
There has been no new MA-cross, so the chart does not yet show a fresh trend shift. The SMA20 slope of 0.33% over 5 days is mildly positive, which means the short-term drift has improved, but only modestly. As shown in the chart, the price is trading near the top of the recent range, at 90% of that band, with 4.47 acting as immediate resistance and 4.37 as support.
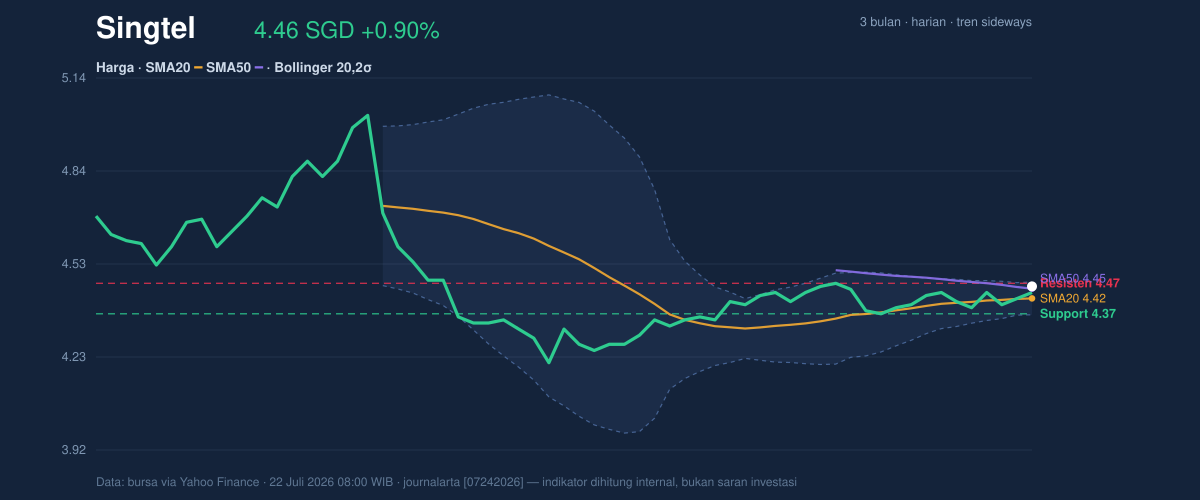
That positioning is constructive, but not decisive. A stock sitting this close to resistance can either be building pressure for a breakout or stalling just before sellers reassert control. The difference will likely be decided by whether the price can hold above the mid-4.40s after this initial push.
Oscillators & Momentum
The momentum picture is calmer than the price action suggests. RSI at 52.8 is neutral, which means the stock is neither overbought nor oversold and still has room to move in either direction without stretching the oscillator. Stochastic %K at 64.3 and %D at 50.0 are also neutral, but the gap between them hints at improving short-term momentum rather than a fully mature upswing.
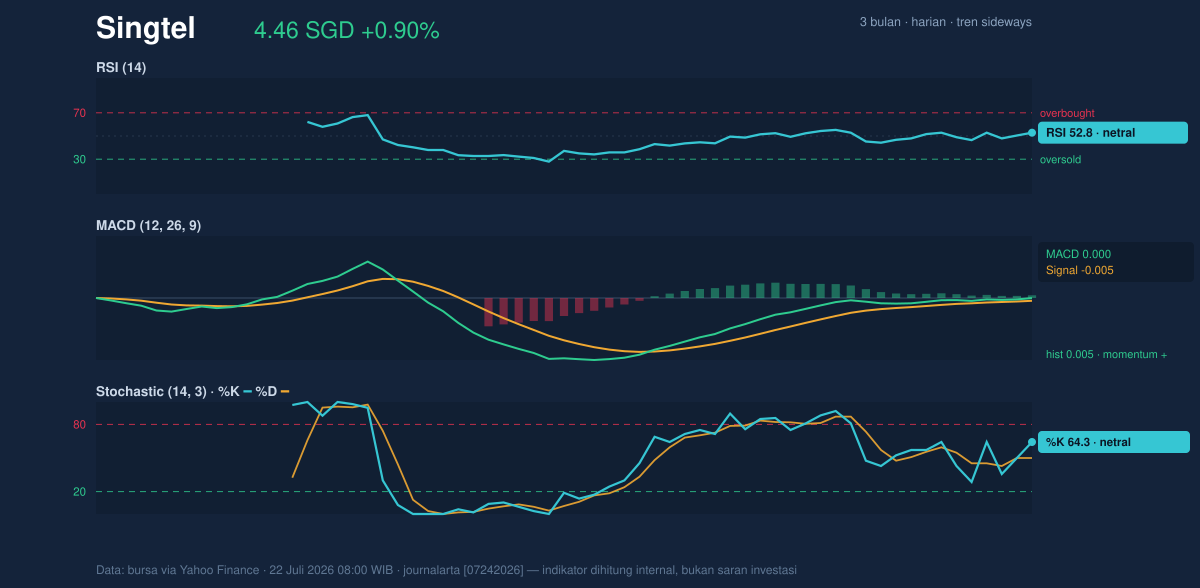
The cleaner signal comes from MACD. MACD at 0.000 versus a signal line of -0.005, with a histogram of 0.005, points to positive momentum, even if only slightly. In plain language, MACD is saying the stock’s recent price action has stopped weakening and is tilting upward. That matters more here because the trend is sideways: in a flat market, even a small positive MACD turn can be an early clue that buyers are gradually gaining control.
Still, this is not a strong momentum breakout. The oscillators are aligned enough to support the recent rise, but not stretched enough to imply urgency. That makes the current move look more like a test of resistance than the start of a powerful trend.
Volatility & Volume
The Bollinger Bands add an important layer to the picture. The upper band is 4.47, the middle band is 4.42, and the lower band is 4.37. With %B at 87%, the price is trading close to the upper band, which shows strength relative to the recent range. At the same time, the 2.4% band width is narrow and described as a squeeze, which often precedes a larger move once the market chooses a direction.
That squeeze is the key technical signal in this setup. It does not predict direction by itself, but it does mean the stock is compressing energy. If price can stay above the middle band and press through 4.47, the chart would be confirming that the compression is resolving upward. If it slips back under the middle band, the same squeeze could unwind into a quick fade.
Volume supports the current advance. Last turnover was 45,169,000, well above the 20-day average of 27,842,505, and OBV is rising. That combination suggests the move is not happening in a thin market. Rising OBV means volume is generally accompanying price gains, which is usually healthier than a price rise built on fading participation. The ATR(14) of 0.07, or 1.6% of price, says daily volatility is moderate, so moves can still be meaningful without appearing disorderly.
Key Levels & Scenarios
The chart’s immediate map is clear. 4.47 is the first barrier, and it lines up with both the upper Bollinger Band and the 20-hour resistance. 4.42 is the mid-band and SMA20 area, so it is the first level that should hold if the stock is to preserve its short-term tone. Below that, 4.37 is the main support, and a break there would weaken the constructive setup quickly.
The wider context also matters. The stock remains below its 3-month high of 5.05 and above its 3-month low of 4.15, which places it in the middle-to-upper part of its recent trading envelope. That is consistent with a market recovering from weakness but not yet proving a full trend reversal.
Technical Verdict: HOLD (wait & see)
HOLD (wait & see) fits best because the chart is improving, but not yet confirmed.
- MACD is slightly positive, which supports the idea that downside momentum has faded.
- Volume is 1.6× average and OBV is rising, showing participation behind the move.
- Bollinger Bands are in a squeeze, so the next directional move could be sharper than recent trading.
Verdict invalidated if price falls below 4.37, because that would break support and undermine the current squeeze setup.
- Ideal Entry Range: 4.42 to 4.47
- Exit Target: 4.47
- Stop Loss protection: 4.37
In plain English, the stock is leaning better, but it still needs to prove it can stay above resistance instead of just visiting it.
Summary Data Singtel
| Last price | 4.46 SGD |
| Change 1 day / 5 days / 1 month | 0.90% / 1.13% / 1.13% |
| Trend / MA-cross | sideways / none |
| SMA20 / SMA50 | 4.42 / 4.45 |
| RSI (14) / Stochastic %K | 52.8 / 64.3 |
| Bollinger %B / ATR | 87% / 0.07 |
| Support / Resistance 20 days | 4.37 / 4.47 |
| Data as of | 22 Juli 2026 08:00 WIB |



