UOB Stock Technicals Today: Gains 0.66%, Momentum Weakens
On Juli 24, 2026: price 43.00 SGD, trend uptrend, RSI 61.2, support 39.65, resistance 44.95. technical analysis of uob stock. UOB Stock Technicals — full…

United Overseas Bank (UOB) traded at SGD 43.00 on the SGX on 22 July 2026, up 0.66% from the previous close of 42.72, but the tape still shows a stock that is advancing inside a broader pause rather than breaking cleanly higher. The share price remains above the SMA20 at 42.06 and well above the SMA50 at 39.79, which keeps the medium-term structure constructive; yet the latest momentum readings suggest the market is not fully convinced that the next leg up is ready to start.
Trend & Price Action
The chart shows UOB sitting in an uptrend, with the SMA20 rising at 1.97% over five days. That matters because a rising short-term average tells traders that recent prices are still pulling the trend higher, even if the pace is uneven. The stock is also trading in the upper part of its recent band, at 63% of the 20-hour range, which usually signals that buyers have regained some control after a pullback.
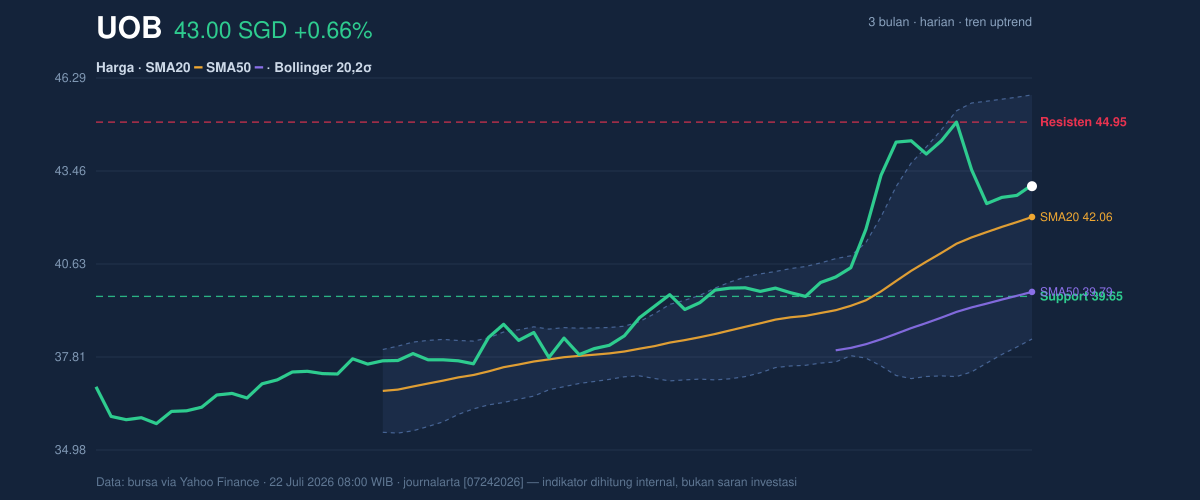
The key point, however, is that UOB is not pressing against resistance with strong conviction. The nearest resistance is 44.95, while the nearest support is 39.65. In plain terms, the market has room to test higher levels, but it has not yet proven it can escape the current range. The stock’s 3-month high of 45.15 sits just above resistance, so the next stretch of price discovery is close, but not yet confirmed.
Oscillators & Momentum
Momentum is where the story becomes more cautious. The RSI at 61.2 is neutral-to-firm, which means the shares are not overbought and still have some room to rise before momentum looks stretched. The Stochastic %K at 59.7 and %D at 57.4 are also neutral, reinforcing the idea that UOB is neither overheated nor washed out.
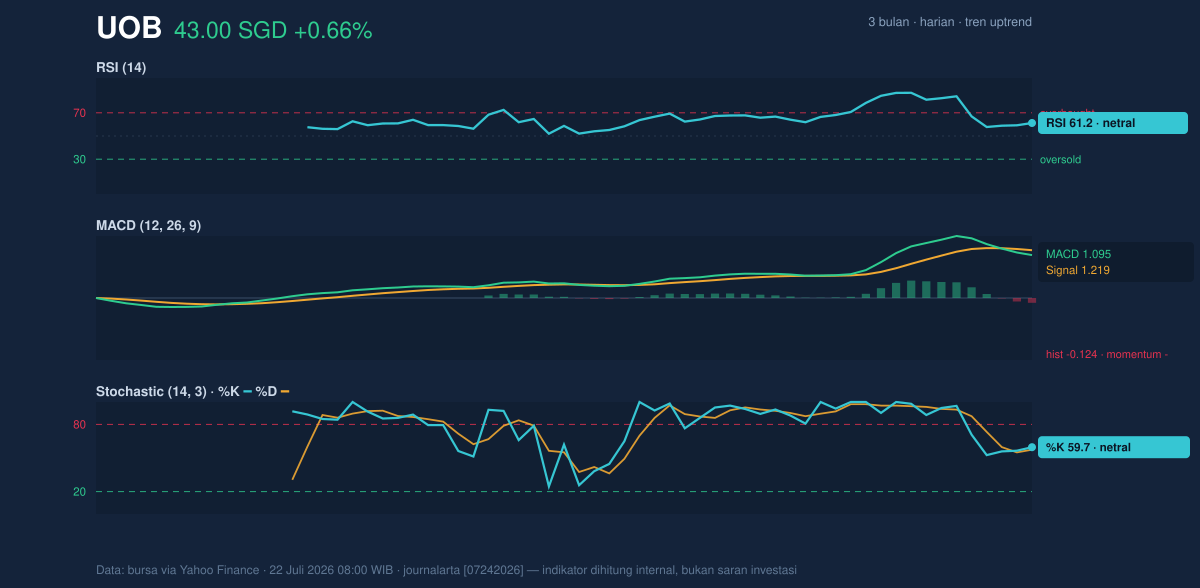
The more important signal is the MACD at 1.095 versus its signal line at 1.219, leaving a negative histogram of -0.124. That negative spread means the shorter-term price impulse has slipped below the trend-following signal, often a sign that upside momentum is cooling even while the broader trend remains intact. For readers, that is the difference between “still trending up” and “moving up with less force.” It does not automatically mean a reversal; it means the advance is losing some urgency.
Volatility & Volume
Volatility is contained rather than explosive. The ATR of 1.01, equal to 2.3% of price, points to moderate daily movement, so traders should expect normal swings rather than a sudden shock. Bollinger Bands are also telling a balanced story: the upper band is 45.78, the middle band is 42.06, and the lower band is 38.35, with %B at 63% and a 17.6% band width. That combination suggests price is leaning above the mid-band, but the bands are not compressing into a classic squeeze, nor are they expanding sharply. In other words, the market is drifting upward inside a normal volatility envelope.
Volume confirms participation without enthusiasm. Last volume was 3,485,600, almost exactly in line with the 20-hour average of 3,457,776, or 1.0× normal. That tells us the move higher is being accepted, but not chased. Meanwhile, OBV is rising, which is constructive because it implies net buying pressure has been building beneath the surface, even if the MACD says the momentum has softened. When price and OBV rise together, it usually means accumulation is still present.
Key Levels & Scenarios
The immediate map is clear. 43.00 is holding above the short-term average at 42.06, which keeps the trend bias positive. If UOB can push through 44.95, the chart would be opening a path toward the 3-month high of 45.15, and then the Bollinger upper band at 45.78 becomes the next technical ceiling. If it fails to hold above 42.06, the market starts to lose the benefit of its short-term trend, and a deeper test of 39.65 would become more likely.
The key signal is that UOB is still above its moving-average structure, but the negative MACD histogram means the stock needs fresh demand to convert support into a new advance. Without that, the price may continue to oscillate between the mid-band and resistance rather than break out decisively.
Technical Verdict: HOLD (wait & see)
HOLD (wait & see)
- Reason 1: Trend remains constructive — price is above the SMA20 at 42.06 and SMA50 at 39.79, with the SMA20 still rising.
- Reason 2: Momentum is mixed — RSI 61.2 and Stochastic 59.7/57.4 are neutral, but the MACD histogram at -0.124 shows fading short-term force.
- Reason 3: Participation is supportive but not emphatic — volume is only 1.0× normal, while OBV is rising, suggesting underlying accumulation without a strong breakout push.
- Verdict invalidated if price falls below 39.65, because that would break the nearest support and weaken the current uptrend structure.
- Ideal Entry Range: 42.06 to 42.06, near the SMA20 and Bollinger middle band where trend support is visible.
- Exit Target: 44.95 to 45.15, aligned with resistance and the 3-month high.
- Stop Loss protection: 39.65, just below the nearest support.
For non-traders, this means UOB still looks technically healthy, but the chart is asking for confirmation before the next move becomes convincing. The next scheduled test is the push toward 44.95 and then 45.15, where the market will show whether buyers are ready to take control again.
Summary Data UOB
| Last price | 43.00 SGD |
| Change 1 day / 5 days / 1 month | 0.66% / -4.34% / 7.77% |
| Trend / MA-cross | uptrend / none |
| SMA20 / SMA50 | 42.06 / 39.79 |
| RSI (14) / Stochastic %K | 61.2 / 59.7 |
| Bollinger %B / ATR | 63% / 1.01 |
| Support / Resistance 20 days | 39.65 / 44.95 |
| Data as of | 22 Juli 2026 08:00 WIB |


