AIA Stock Drops 0.64% Today, Testing Key Resistance
On Juli 27, 2026: price 78.10 HKD, trend sideways, RSI 60.2, support 70.80, resistance 78.60. technical analysis of aia stock. AIA Stock Drops — full details…

AIA Group’s shares edged down to 78.10 HKD on HKEX on 24 July 2026, slipping 0.64% from the previous close of 78.60 even as the stock remains up 3.38% over five days and 8.17% over one month. The move leaves the insurer sitting near the top of its recent trading band, with the chart showing price at 94% of the 20-hour range. That matters because a stock that is already close to the upper edge of its range often needs either stronger volume or a fresh catalyst to keep extending higher.
Trend & Price Action
The broader pattern is still sideways, but the short-term tone has improved. Price is above SMA20 at 74.32 and also above SMA50 at 77.25, which tells traders the shares are trading above both the near-term and medium-term average cost bases. In plain language, that usually means recent buyers are in profit and the market is not under immediate downward pressure.
The absence of a new MA-cross suggests the trend has not shifted into a decisive new phase. The 20-day moving average is rising at 1.33% over five days, which is constructive, but the word “sideways” still describes the bigger picture: momentum has improved without yet breaking the stock out of its broader range.
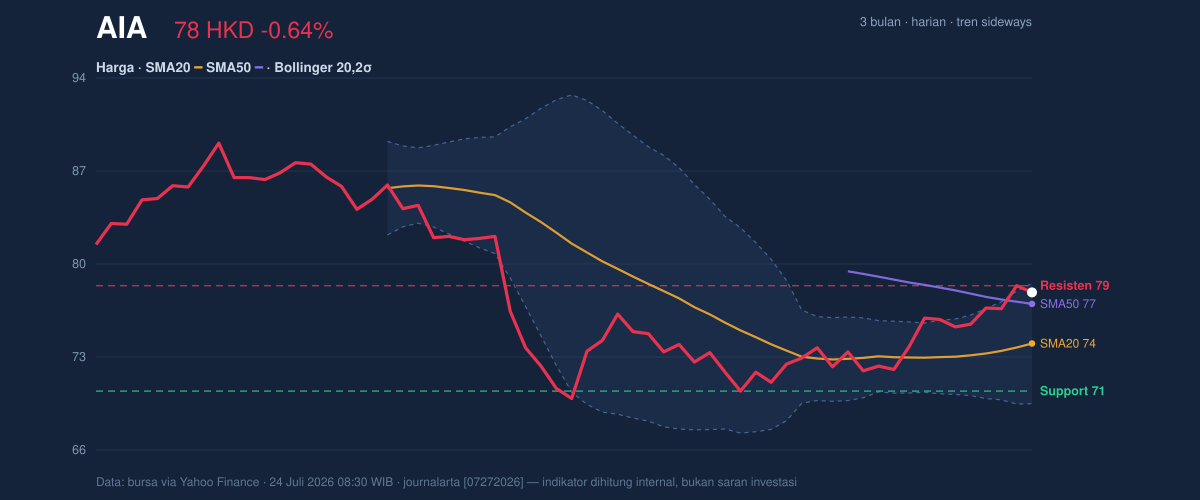
The price is also pressing against resistance at 78.60, just below the current level, while support sits at 70.80. That narrow gap to resistance explains why the recent advance may start to look stretched if buyers cannot absorb supply above the prior close. The broader three-month range, from 69.05 to 89.95, shows there is still room above, but the market has not yet proven it can move through the upper end of the near-term ceiling.
Oscillators & Momentum
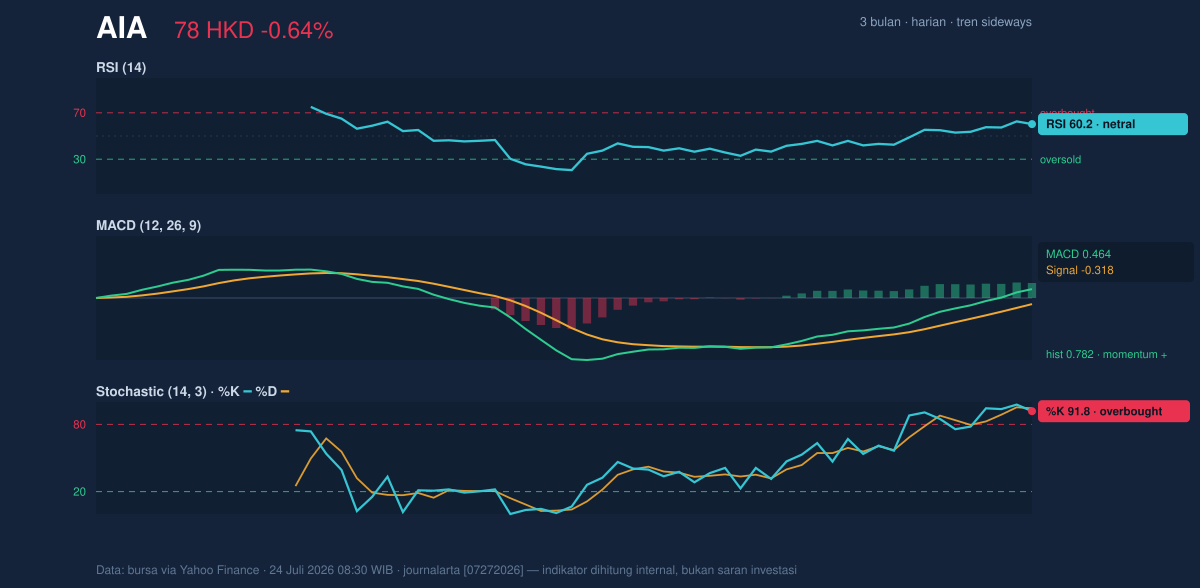
Momentum is mixed, and that is the key signal in this name right now. The RSI at 60.2 is neutral, which means the stock is not yet in a classic overbought state on that gauge. But the Stochastic at 91.8 / 94.4 is clearly overbought, and that matters because it shows the share price is closing near the top of its recent range with little room for immediate extension before short-term traders start to take profits.
The MACD is positive at 0.464, with the signal line at -0.318 and histogram at 0.782. In practical terms, that means upward momentum is still stronger than the slower trend measure, so the stock has not lost its underlying lift. The catch is that the oscillator picture is not fully aligned: MACD says the trend has upside energy, while Stochastic says the move is already extended in the short term. That kind of split often appears near resistance, where momentum is healthy but the next leg needs a pause or a breakout to continue.
Volatility & Volume
Volatility is moderate. ATR(14) at 2.00, equal to 2.6% of price, suggests the stock is capable of moving, but not in a disorderly way. The Bollinger Band width of 12.0% is described as normal, so this is not a squeeze that typically precedes a sharp expansion, nor is it a runaway volatility regime. Price at %B 92% means it is trading very close to the upper band at 78.77. That is a classic sign of strength, but also a warning that the easy part of the move may already be done.
Volume does not yet confirm a decisive breakout. Last volume was 22,838,041, below the 20-hour average of 26,468,756, or about 0.9× normal. That is important because rallies that approach resistance on lighter participation are more vulnerable to stalling. The OBV is down, which means cumulative volume flow has not fully endorsed the recent price firmness. When price is elevated but OBV is slipping, it often signals that demand is present, but not broad enough to force a clean trend continuation.
Key Levels & Scenarios
The market is now balancing a short-term breakout attempt against the risk of a pullback toward the middle of the range. If the share price can move decisively through 78.60 resistance with stronger participation, the next reference point becomes the 78.77 upper Bollinger band, with the broader three-month high at 89.95 marking the upper end of the recent historical range. If it fails to hold above the current zone, the first meaningful support is 74.32 at the SMA20, followed by 70.80 support.
The chart setup suggests a stock that is technically firm but not yet fully confirmed. Price is above the key averages, MACD remains constructive, and the Bollinger position shows strength. Yet the overbought Stochastic, lighter-than-average volume, and falling OBV all argue that this advance may need either a pause or a stronger catalyst before it can extend further.
Technical Verdict: HOLD (wait & see)
- Reason 1: MACD is positive, so the underlying momentum trend is still supportive.
- Reason 2: Price is above SMA20 and SMA50, which keeps the structure constructive.
- Reason 3: Stochastic is overbought and volume is 0.9× normal, so the move is extended without strong participation.
- Verdict invalidated if price breaks below 74.32, the SMA20 and the first major support reference.
- Ideal Entry Range: 74.32 to 77.25 HKD
- Exit Target: 78.77 HKD
- Stop Loss protection: 70.80 HKD
In simple terms, the chart still leans firm, but it is close enough to resistance that the next move needs confirmation rather than assumption.
Summary Data AIA
| Last price | 78.10 HKD |
| Change 1 day / 5 days / 1 month | -0.64% / 3.38% / 8.17% |
| Trend / MA-cross | sideways / none |
| SMA20 / SMA50 | 74.32 / 77.25 |
| RSI (14) / Stochastic %K | 60.2 / 91.8 |
| Bollinger %B / ATR | 92% / 2.00 |
| Support / Resistance 20 days | 70.80 / 78.60 |
| Data as of | 24 Juli 2026 08:30 WIB |


