HSBC Stock Analysis: Drops 1.89%, Momentum Gains
On September 10, 2026: price 1,549.20 GBp, trend uptrend, RSI 63.4, support 1,497.20, resistance 1,580.20. technical analysis of hsbc stock.
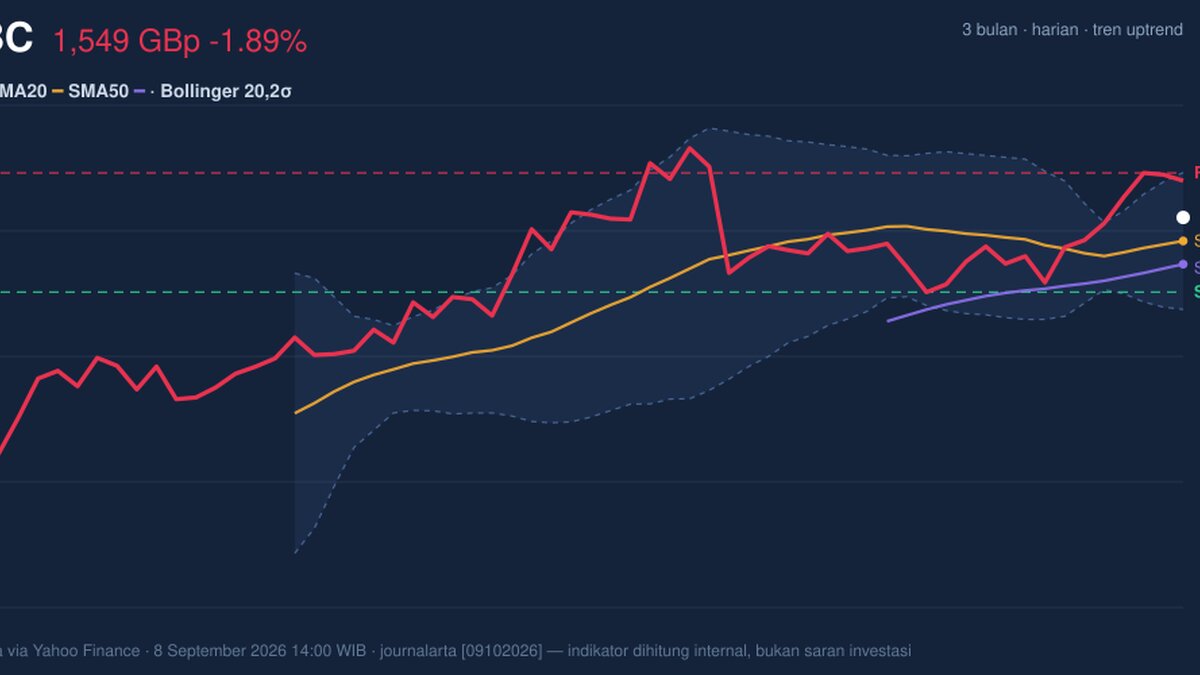
HSBC Holdings ended the session at 1,549.20 GBp, down 1.89% on the day, but the larger message from the chart is more constructive than the daily pullback suggests. The shares are still trading above the 20-day average at 1,532.81 and above the 50-day average at 1,516.65, which keeps the short-term structure in an uptrend. What matters here is not just that the stock slipped, but that it slipped from a position of strength: price remains inside a rising range and is still holding above the middle Bollinger band, a level that often acts like a moving line between consolidation and renewed advance.
That said, the move was not random noise. It came after a run that has left parts of the momentum setup stretched, and the chart now shows a market that is still constructive but less comfortable at the top end of its recent range. The question is whether this is a pause within an uptrend or the first sign that buyers are losing urgency.
Trend & Price Action
As shown in the chart, HSBC is trading between the 20-day SMA at 1,532.81 and the upper Bollinger band at 1,580.49, with the price sitting at about 63% of the 20-hour range. That placement matters: it says the stock is not under distribution pressure, but neither is it breaking out decisively. The 20-day slope of 0.56% over 5 days confirms the trend is still rising, while the lack of a fresh MA-cross means the current move is being supported by trend persistence rather than a new technical trigger.
The broader context is also important. HSBC is still well above the 3-month low of 1,267.20 and only modestly below the 3-month high of 1,610.00. In plain language, the stock has already done the hard work of recovering much of its prior weakness, and now it is testing whether that recovery can extend into a higher trading band.
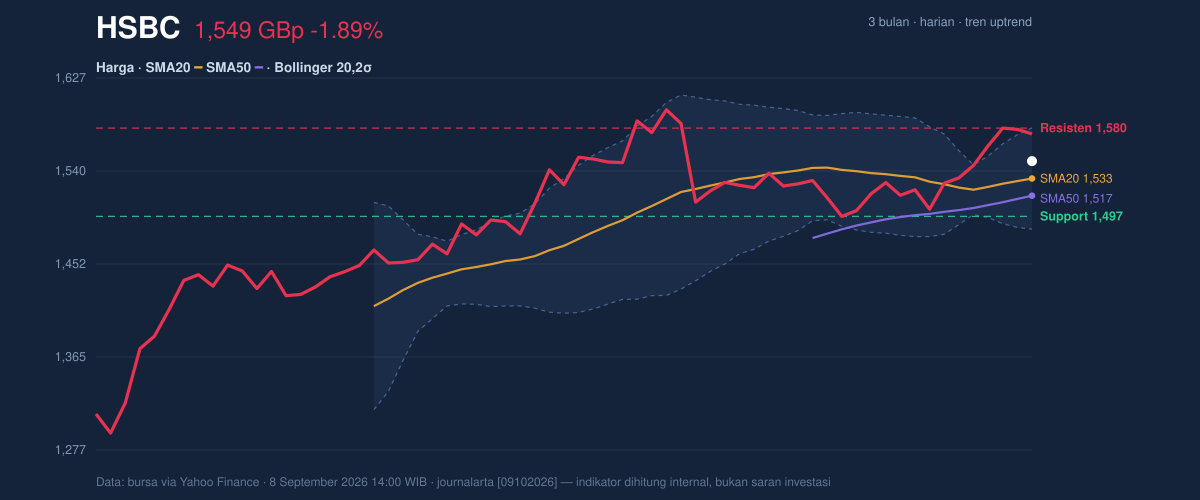
Support at 1,497.20 is the first level that matters if the current pullback deepens, while resistance at 1,580.20 remains the near-term ceiling. A move through that resistance would likely tell traders the market is willing to reprice HSBC closer to the top of its recent range. If price fails to defend the lower support zone, the tone shifts from consolidation to correction.
Oscillators & Momentum
The momentum picture is mixed, and that mix is the key signal. RSI at 63.4 is still in neutral territory, which means the stock is not yet technically overheated on a broad momentum basis. But the Stochastic reading of 88.7 / 93.4 is clearly overbought, indicating the shares have been climbing fast enough that short-term buying pressure may be getting crowded. In practical terms, Stochastic is often the faster warning light: it tells readers the stock may be vulnerable to a pause even while the broader trend remains intact.
That is where the MACD at 15.027 versus signal at 9.996 becomes important. The positive histogram of 5.031 shows momentum is still expanding in the bullish direction, so the stock has not yet lost its underlying thrust. The result is a classic split-screen setup: trend and MACD remain supportive, while Stochastic says the rally is getting stretched in the short term.
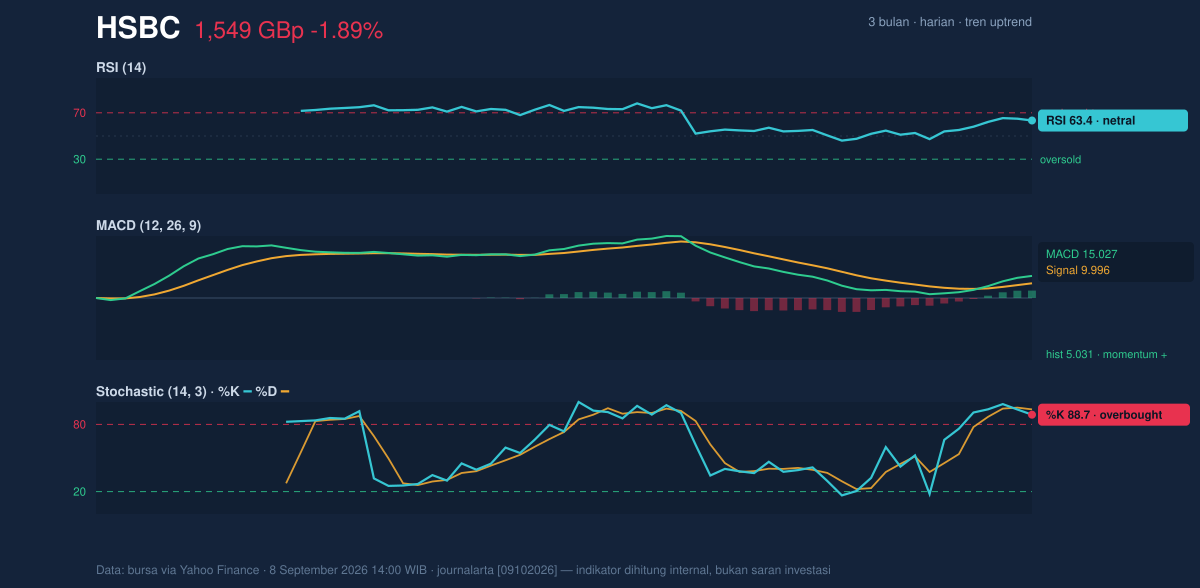
This combination usually means the market is not ready to reverse just because it is overbought. Instead, it often needs either a brief cooling-off period or a stronger push through resistance to reset the chart.
Volatility & Volume
The volatility backdrop is also telling. The Bollinger band width of 6.2% is narrowing, which suggests a squeeze — a phase where price movement compresses before a larger directional move. Because HSBC is sitting near the upper half of the band structure with %B at 67%, the stock is leaning bullish within that squeeze, but not yet in breakout territory. A squeeze does not predict direction by itself; it simply means the market is storing energy. The direction will be decided by whether price can push through the upper boundary or slip back toward the middle band.
Volume adds a cautionary note. Last trade volume of 14,659,967 was only 0.7× normal versus the 20-hour average of 19,719,317. That means the day’s decline was not driven by heavy selling pressure. At the same time, the OBV is rising, which suggests accumulated buying interest has been better than the day’s headline move implies. In other words, the broader participation trend still looks constructive even if the latest session was softer.
Key Levels & Scenarios
The technical map is fairly clear. 1,532.81 is the first pivot because it is both the 20-day SMA and the Bollinger middle band, making it a key line for trend health. Below that, 1,497.20 is the nearest support that can absorb a deeper pullback. On the upside, 1,580.20 and 1,580.49 are the immediate barriers that need to give way before the chart can challenge the 3-month high of 1,610.00.
If HSBC holds above the mid-band and support zone, the squeeze setup leaves room for an upward resolution. If it loses the 20-day average, the chart would be signaling that the recent advance is losing traction and needs a reset.
Technical Verdict: HOLD (wait & see)
HOLD (wait & see) fits best because the chart is still in an uptrend, MACD remains positive, and OBV is rising, but the Stochastic is overbought and price is approaching a tight resistance area inside a Bollinger squeeze. That combination argues for patience rather than chasing strength or assuming a reversal.
- Ideal Entry Range: 1,532.81 to 1,497.20
- Exit Target (Target Price): 1,580.20 to 1,610.00
- Stop Loss protection: below 1,497.20
The verdict is invalidated if price breaks below 1,497.20, because that would weaken the current support structure and turn the pullback into something more than a routine pause.
For non-traders, this means HSBC still looks technically healthy, but the stock is close enough to resistance that the next move matters more than the last one.
HSBC closed at 1,549.20 GBp, with resistance at 1,580.20 and support at 1,497.20.
Summary Data HSBC
| Last price | 1,549.20 GBp |
| Change 1 day / 5 days / 1 month | -1.89% / 1.03% / 1.49% |
| Trend / MA-cross | uptrend / none |
| SMA20 / SMA50 | 1,532.81 / 1,516.65 |
| RSI (14) / Stochastic %K | 63.4 / 88.7 |
| Bollinger %B / ATR | 67% / 26.14 |
| Support / Resistance 20 days | 1,497.20 / 1,580.20 |
| Data as of | 8 September 2026 14:00 WIB |
Track HSBC share price daily: live levels, support/resistance and our full HSBC analysis history.



