AstraZeneca Stock Technicals Today: Drops 0.14%, Momentum Weakens
On Juli 27, 2026: price 12,670.00 GBp, trend downtrend, RSI 40.3, support 12,364.00, resistance 14,538.00. technical analysis of astrazeneca stock.

AstraZeneca shares on the LSE edged down to 12,670.00 GBp by 24 July 2026 at 14:00 WIB, a small daily decline that matters less on its own than the broader pattern beneath it: the stock is still trading below its 20-day and 50-day averages, while the gap between those averages and the latest price keeps the near-term bias tilted lower. That is the market’s message in plain terms. The shares are not in freefall, but they are still trying to recover from a weak month, and the chart shows a stock that has yet to prove the recent bounce is more than a pause.
Trend & Price Action
The biggest signal is the structure of the trend, not the one-day move. AstraZeneca is in a downtrend, and the SMA20 at 13,291.60 is falling at -2.29% over five days, which tells traders that the short-term trend is still pointing down rather than flattening out. With the share price also below the SMA50 at 13,503.24, the stock remains under both the short- and medium-term trend gauges, a setup that usually signals sellers still have the upper hand.
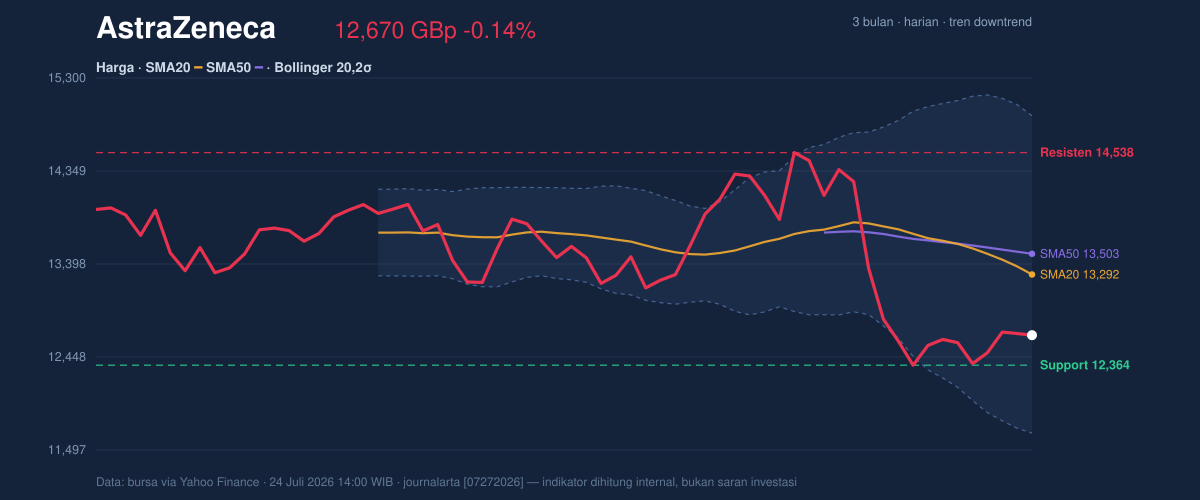
The latest price sits in the lower portion of the recent range, at about 14% of the 20-day support/resistance band. That positioning is important because it suggests the market has not yet forced a decisive reversal. In practical terms, the share price is closer to support than resistance, but it is not yet showing the kind of strength that would normally accompany a trend turn. The 3-month high of 15,126.00 and low of 9,892.00 frame the larger battleground: the stock has room to recover, but it is still trading well below the upper part of that range.
Oscillators & Momentum
The momentum indicators are less bearish than the trend, but they do not yet confirm a turn. RSI at 40.3 is neutral, which means the stock is neither oversold enough to signal an exhausted selloff nor strong enough to imply buyers have regained control. That is a subtle but important point: neutrality after a decline often reflects hesitation, not healing.
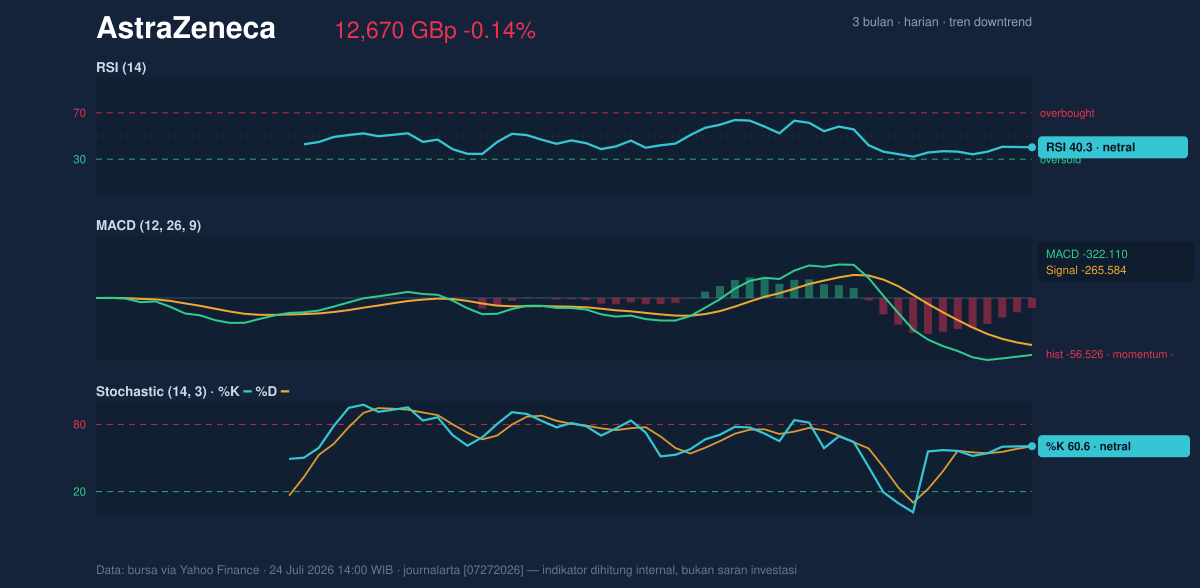
The Stochastic %K at 60.6 and %D at 60.3 also sits in neutral territory, showing that short-term momentum has recovered from weakness but has not broken into a convincing bullish phase. The more telling indicator is MACD at -322.110, still below its signal line at -265.584, with a negative histogram of -56.526. In plain language, MACD is still saying the downtrend has not been fully exhausted; price momentum remains weaker than the trendline suggests. When MACD is negative and the histogram is below zero, it usually means the rebound is losing force before it can challenge the broader decline.
Volatility & Volume
Volatility is elevated, and that raises the odds of sharp swings in either direction. The Bollinger Band width of 24.4% shows the bands are widening, which is a sign of higher volatility rather than a calm consolidation. The latest price is also at %B 31%, meaning it is sitting in the lower third of the band structure, not close to the upper envelope where stronger momentum would usually appear. The lower Bollinger band at 11,669.53 is now a meaningful technical floor, while the middle band at 13,291.60 doubles as the first recovery hurdle.
The ATR(14) at 748.08, or 5.9% of price, confirms that daily movement is wide enough to make short-term levels less reliable than usual. This is not a quiet chart. The stock can travel quickly, and that means breaks need follow-through to matter.
Volume is not helping the bulls. Last session’s volume of 1,845,837 was only 0.7x normal versus the 20-session average of 2,528,181, while OBV is falling. That combination suggests the latest price action lacks broad participation. In technical analysis, falling OBV means volume is not confirming price stability, so rallies are more vulnerable to fading unless turnover improves.
Key Levels & Scenarios
The nearest support is 12,364.00, and that level matters because it sits just below the current price and marks the first area where buyers have recently shown up. If that floor gives way, the chart would likely shift back toward the lower Bollinger band at 11,669.53, which is the next visible technical reference from the data. On the upside, the first major resistance is 14,538.00. That is the level that would need to be reclaimed to argue that the rebound has more than short-covering behind it.
The middle Bollinger band at 13,291.60 and the SMA20 at 13,291.60 are aligned, which makes that area especially important. When the moving average and Bollinger midline match, it often becomes a pivot zone: above it, sentiment starts to improve; below it, the trend remains under pressure.
Technical Verdict: HOLD (wait & see)
HOLD (wait & see)
- MACD remains negative and below its signal line, so downside momentum has not fully cleared.
- Price is below the SMA20 and SMA50, which keeps the broader short-term trend bearish.
- RSI and Stochastic are neutral, meaning the chart is not oversold enough to signal a clean reversal, but not strong enough to confirm a breakout either.
Verdict invalidated if price falls below 12,364.00, because that would weaken the nearest support and reopen the path toward the lower Bollinger band at 11,669.53.
- Ideal Entry Range: 12,364.00 to 13,291.60
- Exit Target: 13,291.60 to 14,538.00
- Stop Loss protection: below 11,669.53
For non-traders: the chart says AstraZeneca is still trying to recover, but the trend has not yet turned strong enough to call it a clean rebound.
Summary Data AstraZeneca
| Last price | 12,670.00 GBp |
| Change 1 day / 5 days / 1 month | -0.14% / 0.60% / -11.51% |
| Trend / MA-cross | downtrend / none |
| SMA20 / SMA50 | 13,291.60 / 13,503.24 |
| RSI (14) / Stochastic %K | 40.3 / 60.6 |
| Bollinger %B / ATR | 31% / 748.08 |
| Support / Resistance 20 days | 12,364.00 / 14,538.00 |
| Data as of | 24 Juli 2026 14:00 WIB |


