1,552.80 GBp is where HSBC Holdings’ London-listed shares closed in the latest session, up 1.69% on the day and 9.15% over the past month, with the stock now pressing against the top of its recent trading range, according to data from Yahoo Finance. That matters because the move is not just a one-day bounce: it sits inside a broader uptrend, with price holding above both the SMA20 at 1,476.02 and the SMA50 at 1,420.96. In plain terms, the shares are still being carried by positive trend structure, but the latest readings also show the market may be running a little hot.
Trend & Price Action
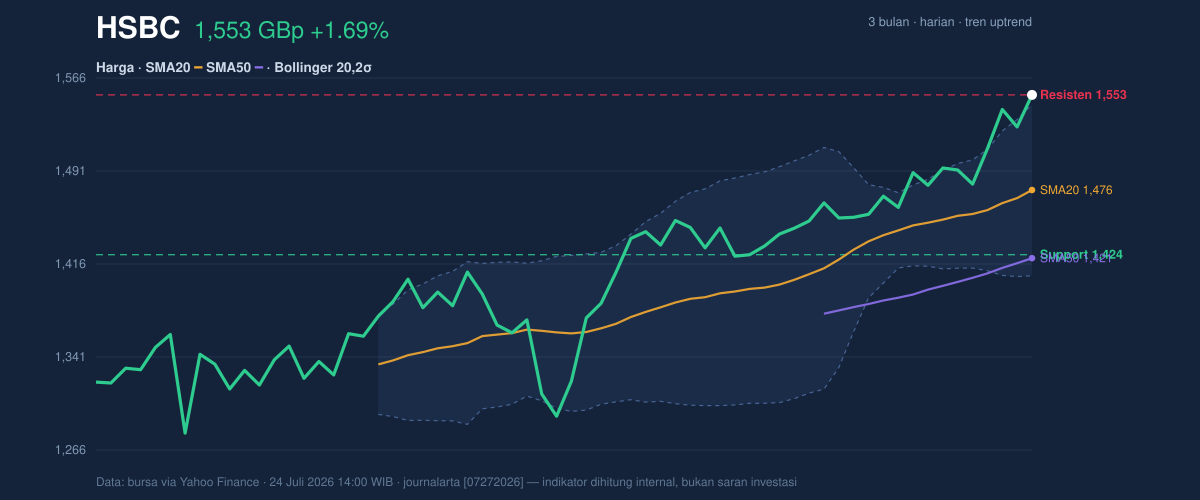
The chart shows a stock that has climbed from the middle of its range to the upper edge of it, with the price above the SMA20 and the shorter average itself still rising at 1.43% over 5 days. That slope is important: it tells readers the recent advance is not merely a single spike, but part of a broader upward drift. The absence of a fresh MA-cross does not weaken the setup; it simply means the trend is being sustained rather than newly triggered. HSBC is also trading well above the SMA50, which usually signals that buyers have been willing to pay up over a longer window.
3-month price action chart of HSBC: price, SMA20/50, Bollinger, support & resistance. Data: exchange via Yahoo Finance.
The key detail, though, is where the price sits in relation to the band and range. At 1,552.80, the shares are effectively at the top of the 20-hour range, and just above the upper Bollinger band at 1,545.26. That is a classic sign of strength, but it can also mean the market is stretched.
Oscillators & Momentum
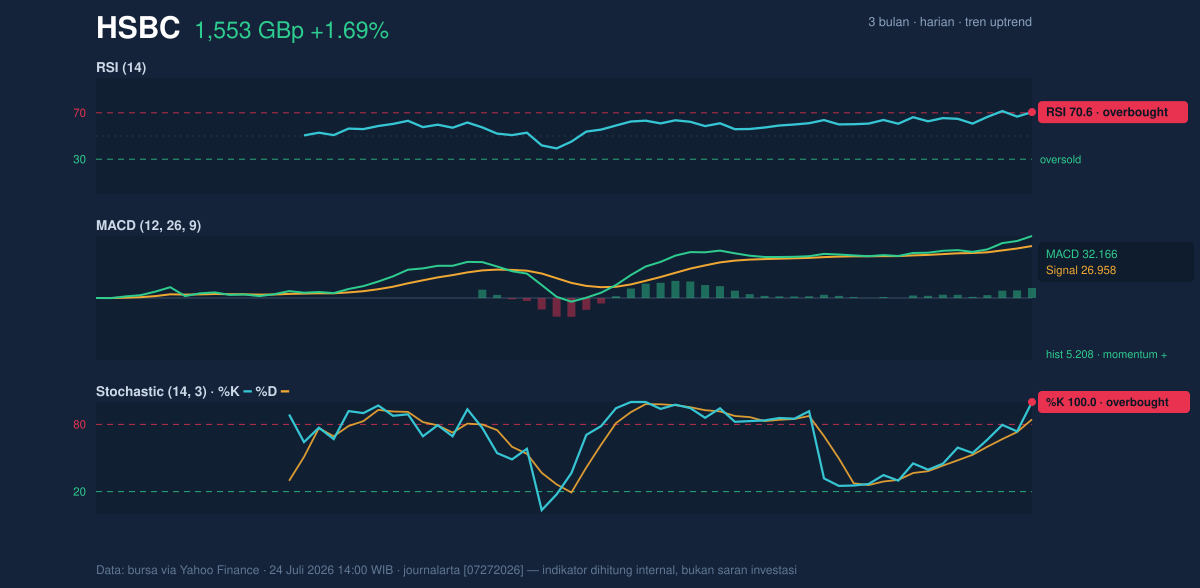
Momentum chart of HSBC: RSI(14), MACD, Stochastic. Data: exchange via Yahoo Finance.
Momentum indicators are flashing a mixed message. The RSI at 70.6 and Stochastic %K at 100.0 / %D at 84.4 both sit in overbought territory, which does not automatically mean a reversal is due, but it does mean recent gains have been strong enough that the stock may be vulnerable to a pause or consolidation. In technical terms, overbought signals often describe speed, not destiny: they show enthusiasm has become elevated, and that can be sustained in a strong trend, but it also reduces the margin for error.
The more supportive part of the picture is the MACD at 32.166, above its signal line at 26.958, with a histogram of 5.208. That combination indicates positive momentum is still expanding, not fading. So while RSI and Stochastic warn of near-term exhaustion, MACD says the broader push remains intact. That’s the tension in this chart: strong trend confirmation, but with momentum already extended.
Volatility & Volume
The volatility backdrop is moderate rather than explosive. HSBC’s ATR(14) of 35.63 equals about 2.3% of the share price, which suggests normal daily movement is still large enough to matter, but not extreme. The Bollinger band width of 9.4% is described as normal, so this is not a squeeze setup where a dramatic breakout is being stored up. Instead, the stock is already moving, and the question is whether it can keep climbing without a breather.
Volume helps confirm the move. Last session’s turnover of 20,736,753 was about 1.1x the 20-hour average of 18,704,865, while OBV is rising. That combination matters because rising volume and rising on-balance volume suggest the advance has participation behind it, rather than being driven by a thin market. In simple language: more shares are changing hands as the price rises, which usually makes the trend more credible.
Key Levels & Scenarios
The most important line on the chart is the immediate resistance at 1,552.80, which is also the current price. That means the stock is testing the ceiling in real time. Above that, the next reference point from the data is the 3-month high at 1,590.00. On the downside, the first meaningful support is the SMA20 at 1,476.02, followed by the SMA50 at 1,420.96 and the 20-hour support at 1,423.80. The fact that price is at 100% of the 20-hour range suggests the market has little room left inside that band before it needs either a clean breakout or a pullback.
If HSBC can hold above the upper Bollinger band and keep volume firm, the chart would be signaling continuation toward the 1,590.00 area. If it slips back below the 1,545.26 band and then loses the 1,476.02 average, the message would shift from breakout pressure to consolidation.
Technical Verdict: HOLD (wait & see)
HOLD (wait & see)
- RSI 70.6 and Stochastic 100.0 / 84.4 show the share price is overbought, which raises the risk of a pause after the recent climb.
- MACD 32.166 above signal 26.958 and a rising OBV still support the uptrend, so the broader structure has not broken down.
- Price is trading at 1,552.80, just above the upper Bollinger band at 1,545.26 and at the top of the 20-hour range, leaving limited room before the next test of resistance.
- Invalidation condition: this verdict is invalidated if price falls below 1,476.02.
- Ideal entry range: 1,476.02 to 1,545.26
- Exit target: 1,590.00
- Stop loss protection: 1,423.80
For non-traders, this means HSBC’s chart is still strong, but the latest move is stretched enough that the next session matters more than the last one.
The shares closed at 1,552.80 GBp on 24 July 2026, with volume at 20,736,753 versus a 18,704,865 average.