Singtel Stock Drops 1.57% Today, Testing Support Level
On Juli 27, 2026: price 4.39 SGD, trend sideways, RSI 46.7, support 4.37, resistance 4.47. technical analysis of singtel stock. Singtel Stock Drops — full…

Singapore Telecom (Singtel) slipped to 4.39 SGD on SGX in early trading data cited from Yahoo Finance, down from 4.46 the previous close, as the counter stayed in a narrow, sideways band rather than breaking into a new trend. The move is small in absolute terms, but the signal matters: the shares are now trading below both short- and medium-term averages, even as momentum indicators remain mixed and trading volume runs a touch above normal.
Trend & Price Action
The broader picture is one of hesitation. Singtel’s trend is described as sideways, with the SMA20 rising only 0.18% over 5 days, which suggests the stock has not lost all upward bias but is struggling to build follow-through. Price is sitting below the SMA20 at 4.42 and below the SMA50 at 4.44, a modest but important sign that recent buying pressure has cooled. There is no fresh MA-cross, so the chart is not flashing a clean trend reversal signal in either direction.
That matters because moving averages are less about prediction than positioning. When price trades under both averages, rallies tend to meet supply from investors who bought higher and are waiting to reduce exposure, while fresh buyers often want a stronger confirmation before stepping in. In Singtel’s case, the stock is also near the lower half of its recent band, with the 3-month range at 5.05 to 4.15. That places the current price closer to the bottom of the range than the top, but not yet at an extreme.
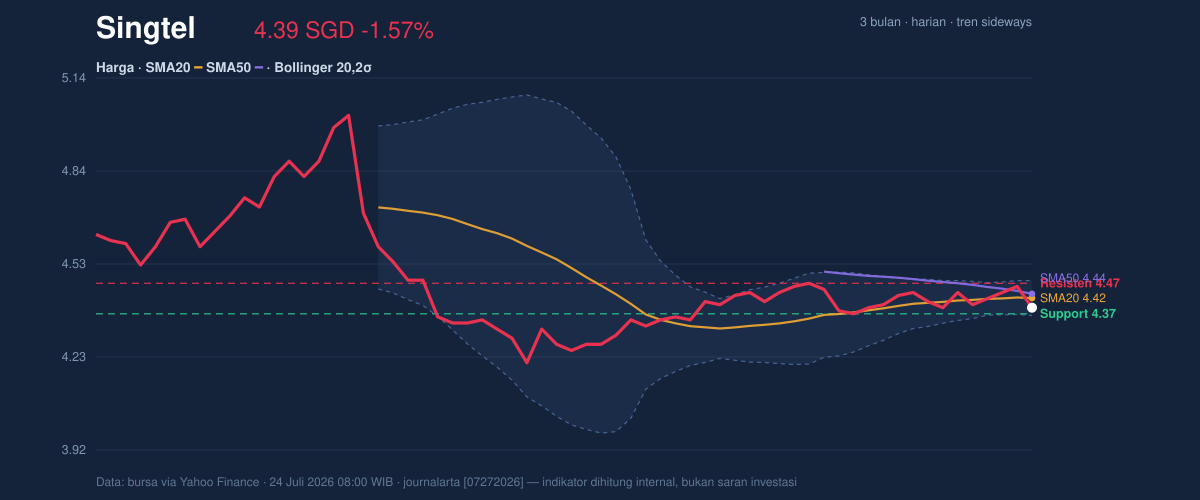
The chart also shows the shares trading near the lower portion of the Bollinger envelope, with the lower band at 4.36 and price at 4.39. In plain terms, that means the stock is close to a level where short-term selling pressure has already done much of its work, but not so far below the band that it looks washed out. The Bollinger width of 2.6% is tight, and that squeeze often precedes a sharper move once the market chooses a direction.
Oscillators & Momentum
Momentum is more constructive than the price action alone would suggest. The RSI at 46.7 is neutral, which means the stock is neither overbought nor oversold and still has room to move either way without immediately hitting an exhaustion signal. The Stochastic %K at 33.3 sits below %D at 60.7, indicating short-term momentum is softer than the recent average, but not yet deeply weak. That gap tells traders the stock has cooled, though it has not entered a panic phase.
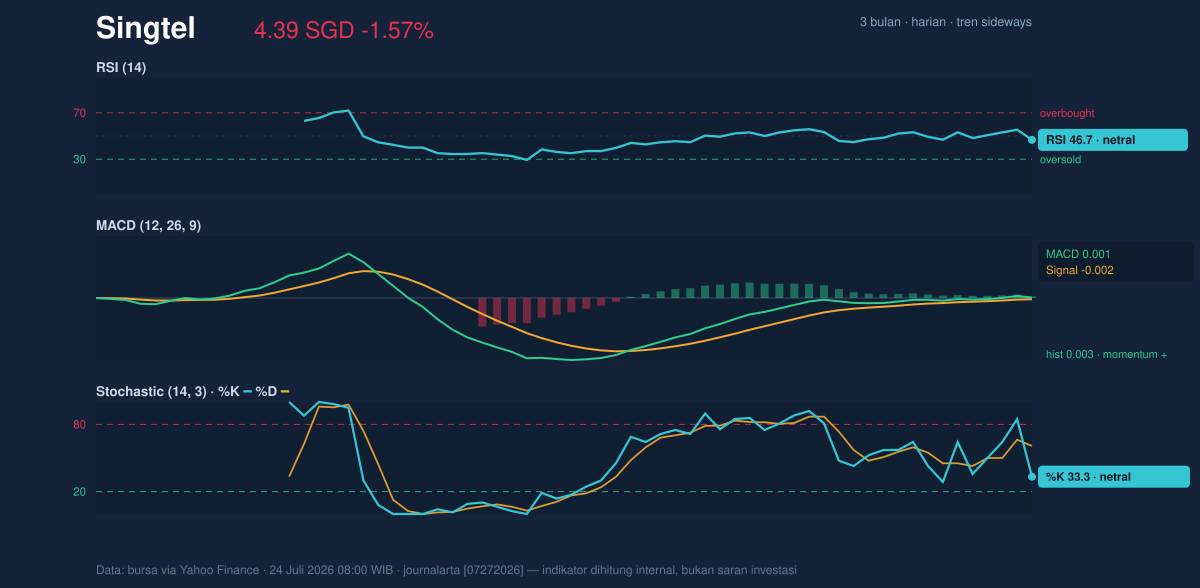
The more encouraging detail is the MACD at 0.001, which is above the signal line at -0.002 and leaves a positive histogram of 0.003. MACD is a trend-following momentum tool, so a positive histogram means the short-term pace is improving relative to the longer baseline. In practical terms, Singtel is not trending strongly, but the internal momentum is tilting upward even while price remains under its averages. That kind of divergence can matter in a tight range: it often signals that the downside may be losing force before the chart itself confirms it.
Volatility & Volume
Volatility is moderate rather than explosive. The ATR(14) at 0.07, equal to 1.6% of price, implies the stock typically moves in fairly contained daily increments. That supports the sideways read: this is not a name currently behaving like a high-beta breakout candidate. Yet the narrow Bollinger band suggests compression, and compressed volatility often acts like a spring. The market is storing energy, not releasing it.
Volume adds a useful layer. Last traded volume of 29,478,500 was 1.1x normal versus the 20-day average of 27,991,095, while OBV is rising. OBV, or on-balance volume, tracks whether volume is flowing into up days or down days; a rising OBV usually means accumulation is quietly outweighing distribution. That is a constructive sign because it suggests the recent softness is not being met with broad-selling conviction. The market is participating, and participation is often what validates a later move.
Key Levels & Scenarios
The nearest reference points are clear. Support at 4.37 is close to the current price, while resistance at 4.47 caps the immediate range. The stock is effectively sitting in the lower fifth of that corridor, which means the next move matters more than the current one. A sustained push above resistance would show that the recent squeeze is resolving upward, while a break below support would confirm that sellers still control the tape.
The Bollinger levels sharpen the picture. The lower band at 4.36 sits just beneath support at 4.37, so the market is testing a zone where technical buyers often try to defend. If that area fails, the chart would likely shift from “quiet consolidation” to “range breakdown.” If price reclaims 4.42 and then 4.47, it would suggest the stock is recovering both its short-term average and the top of the immediate range.
Technical Verdict: HOLD (wait & see)
HOLD (wait & see) fits best because the chart is balanced between mild weakness in price and improving internal momentum.
- RSI is neutral at 46.7, so the stock is not showing a decisive momentum extreme.
- MACD is positive with a 0.003 histogram, which supports the case that downside pressure is easing.
- Price remains below SMA20 at 4.42 and SMA50 at 4.44, so trend confirmation is still missing.
- Verdict invalidated if price breaks below 4.36, the lower Bollinger band and nearby support zone.
- Ideal Entry Range: 4.36 to 4.42
- Exit Target: 4.47 to 4.48
- Stop Loss Protection: below 4.36
In plain English, Singtel looks like a stock waiting for proof, not one already delivering a clear directional move.
Summary Data Singtel
| Last price | 4.39 SGD |
| Change 1 day / 5 days / 1 month | -1.57% / -1.13% / -0.90% |
| Trend / MA-cross | sideways / none |
| SMA20 / SMA50 | 4.42 / 4.44 |
| RSI (14) / Stochastic %K | 46.7 / 33.3 |
| Bollinger %B / ATR | 23% / 0.07 |
| Support / Resistance 20 days | 4.37 / 4.47 |
| Data as of | 24 Juli 2026 08:00 WIB |


