T Testing Key Resistance: Stock Gains 5.10% (Juli 27, 2026)
On Juli 27, 2026: price 24.13 USD, trend sideways, RSI 68.6, support 20.48, resistance 24.13. technical analysis of t stock. Testing Key Resistance — full…

AT&T finished at 24.13 dollars, up 5.10% on the day, and the move pushed the stock to the top of its recent trading band. The signal is not just that the price rose; it is that it rose into resistance, where follow-through matters more than the headline gain.
Trend & Price Action
The chart shows a stock that is still classified as sideways, even after the latest jump. That matters because a sideways trend usually means the market has not yet committed to a sustained direction; traders are still testing whether the recent strength is a breakout or just another swing inside a range.
AT&T is trading above its SMA20 at 21.68 and also above its SMA50 at 22.91, which tells us the short-term tone has improved relative to both the one-month and medium-term averages. But there is no fresh MA-cross, so the move has not yet produced the cleaner trend confirmation that often accompanies a more durable shift. In plain language: the stock has moved ahead of its averages, but the averages have not yet turned into a new, decisive uptrend.
The price is also sitting at the very top of the 20-hour support-resistance range, with support at 20.48 and resistance at 24.13. That means the latest print is not comfortably above resistance; it is exactly at it. As shown in the chart, that position often acts like a pressure point: either the market accepts the higher level and extends, or it fades back into the range.
[BLOK?]
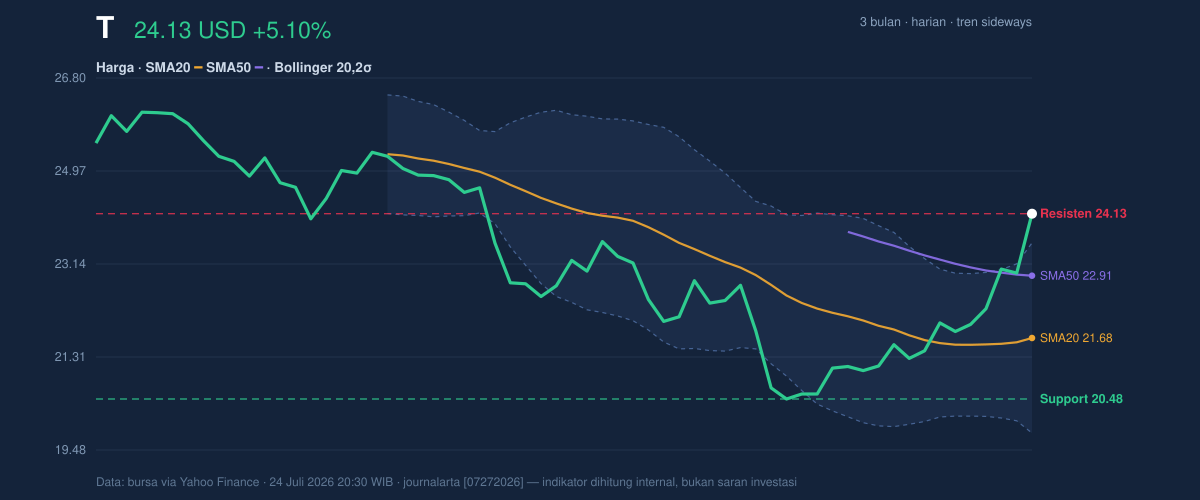
The Bollinger bands reinforce that tension. Price is above the upper band at 23.56, while the middle band sits at 21.68 and the lower band at 19.81. A reading of %B at 115% means the stock has moved beyond the usual upper boundary of the band system, which often signals short-term extension rather than immediate safety. The band width is still normal at 17.3%, so this is not a volatility explosion; it is more of a stretched move within a still-orderly envelope.
Oscillators & Momentum
As shown in the momentum chart, the indicators are aligned enough to support the rally, but not cleanly enough to erase near-term caution.
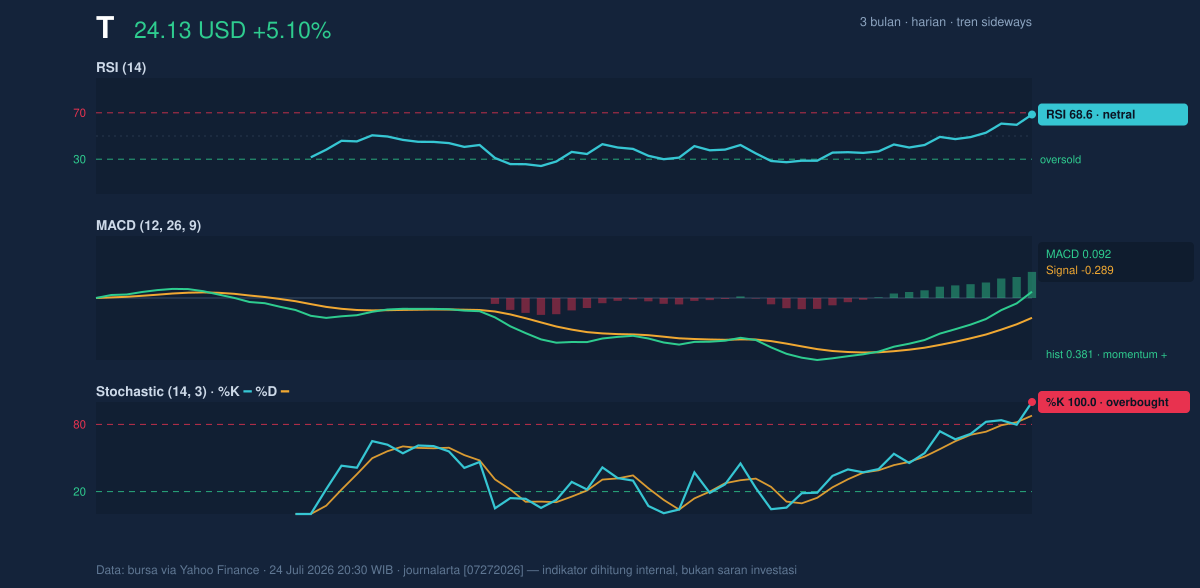
The RSI at 68.6 is described here as neutral, but it is close to the threshold where momentum can become overextended. That means the stock is not yet in a classic overbought breakdown zone, but it is near the point where gains can start to lose efficiency. The more forceful warning comes from the Stochastic oscillator: %K at 100.0 and %D at 87.8 are both in overbought territory. In practical terms, that says the stock has been closing near the top of its recent range repeatedly, which is a sign of strong short-term demand — but also one that often precedes pauses if fresh buyers do not keep arriving.
The MACD is positive at 0.092, with the signal line at -0.289 and the histogram at 0.381. That combination is important because MACD measures whether price momentum is improving faster than its own recent average. A positive histogram this wide suggests the latest move has real thrust behind it, and it is still expanding rather than fading. So the oscillators are sending a mixed message: the trend momentum is positive, but the stock is also stretched enough to invite consolidation.
Volatility & Volume
The ATR at 0.72, or 3.0% of price, points to moderate volatility. That means daily swings are present, but not wild. For readers, ATR is a rough measure of how much the stock tends to move in a day; at this level, a continuation move is possible, but so is a quick retreat if momentum stalls.
Volume adds an important nuance. Last trading volume was 80,638,700, below the 20-day average of 93,532,035, or about 0.9× normal. That weakens the case for a fully confirmed breakout. A strong move on lighter-than-average volume can still work, but it usually needs follow-up participation to prove that institutions are behind it. The OBV is rising, which is constructive because on-balance volume tracks whether volume is accumulating on up days. In other words, the broader participation trend is improving even if the latest session did not arrive with peak volume.
Key Levels & Scenarios
The stock’s 3-month high is 26.47 and the 3-month low is 19.89. That range helps frame the current move: AT&T is closer to the upper end of its recent three-month trading zone, but still below the high that would signal a more complete range expansion.
The most important near-term levels are straightforward. 24.13 is the immediate ceiling because that is where the stock is trading now. Above that, the next reference is the 3-month high at 26.47. On the downside, 22.91 marks the SMA50, followed by 21.68 at the SMA20 and the Bollinger middle band. Below that, 20.48 is the key support from the 20-hour range, with 19.89 as the broader three-month floor.
If price can hold above 24.13 and attract stronger volume, the chart would begin to look less like a range trade and more like an early breakout attempt. If it slips back under 22.91, the message changes quickly: the rally would look more like an overextended bounce inside a sideways structure.
Technical Verdict: HOLD (wait & see)
HOLD (wait & see)
- MACD is positive and the histogram is expanding, which supports upward momentum.
- Price is above the SMA20 and SMA50, showing improved trend structure.
- Stochastic is overbought and price is at 24.13, right on resistance and above the upper Bollinger band, which raises the risk of a pause.
Verdict invalidated if price falls below 22.91, the SMA50, because that would weaken the current rebound and put the stock back inside a less constructive range.
- Ideal Entry Range: 22.91 to 23.56
- Exit Target: 24.13 to 26.47
- Stop Loss Protection: 20.48
For non-traders: the stock looks stronger than it did a few days ago, but it is also stretched enough that the next move matters more than the last one. “We need to see whether this is real demand or just a fast move into resistance,” one trader might say, and that is exactly where AT&T stands now.
Summary Data T
| Last price | 24.13 USD |
| Change 1 day / 5 days / 1 month | 5.10% / 10.64% / 7.63% |
| Trend / MA-cross | sideways / none |
| SMA20 / SMA50 | 21.68 / 22.91 |
| RSI (14) / Stochastic %K | 68.6 / 100.0 |
| Bollinger %B / ATR | 115% / 0.72 |
| Support / Resistance 20 days | 20.48 / 24.13 |
| Data as of | 24 Juli 2026 20:30 WIB |


