Testing Key Resistance, VZ Stock Gains 5.84% Today
On Juli 27, 2026: price 46.38 USD, trend sideways, RSI 62.5, support 41.99, resistance 46.54. technical analysis of vz stock. Testing Key Resistance — full…

Verizon Communications traded higher on the NYSE on 24 July 2026, with VZ last changing hands at 46.38 USD, up from a previous close of 43.82 USD as buying pushed the stock close to its near-term ceiling. The move matters because it is not just a one-day pop: the shares are now sitting near the top of their recent range, and that usually tells investors that sentiment has improved faster than the underlying trend has fully turned.
Trend & Price Action
As shown in the chart, VZ is still described as sideways, even after the latest jump, which means the stock is moving inside a broad band rather than establishing a clean directional trend. That is important: a sideways label after a sharp rise often signals a market that is testing resistance rather than confirming a new uptrend.
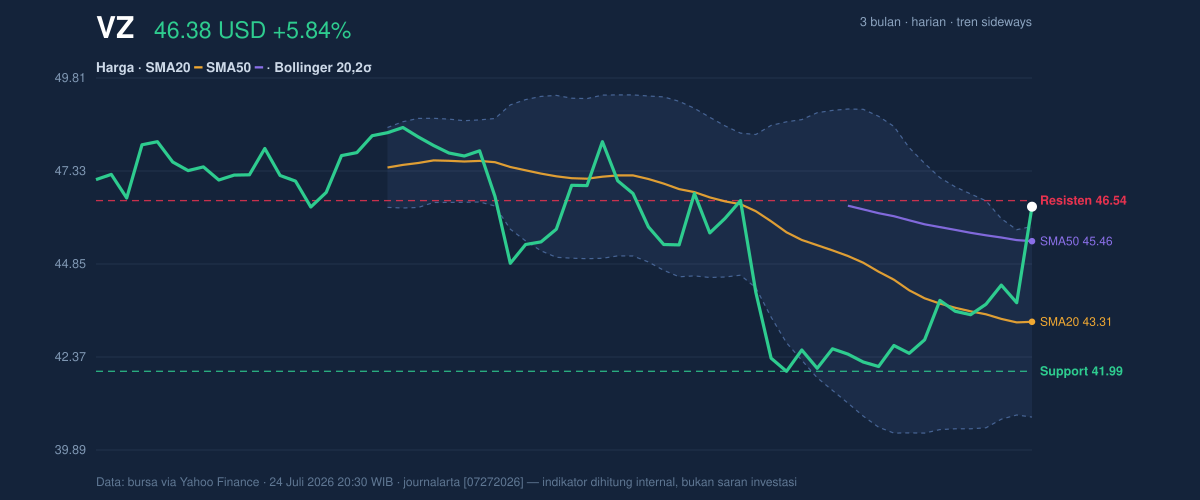
The price is trading above the SMA20 at 43.31 and above the SMA50 at 45.46, which is constructive because it places the stock above both its short- and medium-term averages. When price sits above these lines, it usually means recent buyers are willing to pay more than the average of the last 20 and 50 sessions, a sign that demand has improved.
Still, the chart is not showing a fresh moving-average crossover, so the move is better read as a rebound inside an existing range than a confirmed trend reversal. The stock is also near the upper end of its 3-month band, with the 3-month high at 48.96 and the 3-month low at 40.76, leaving less room overhead before the next historical cap comes into view.
Oscillators & Momentum
The momentum picture is more mixed than the price action alone suggests. The RSI at 62.5 sits in neutral territory, which means the stock is not yet in the classic overbought zone, but it is leaning toward the upper half of the scale and showing improving appetite.
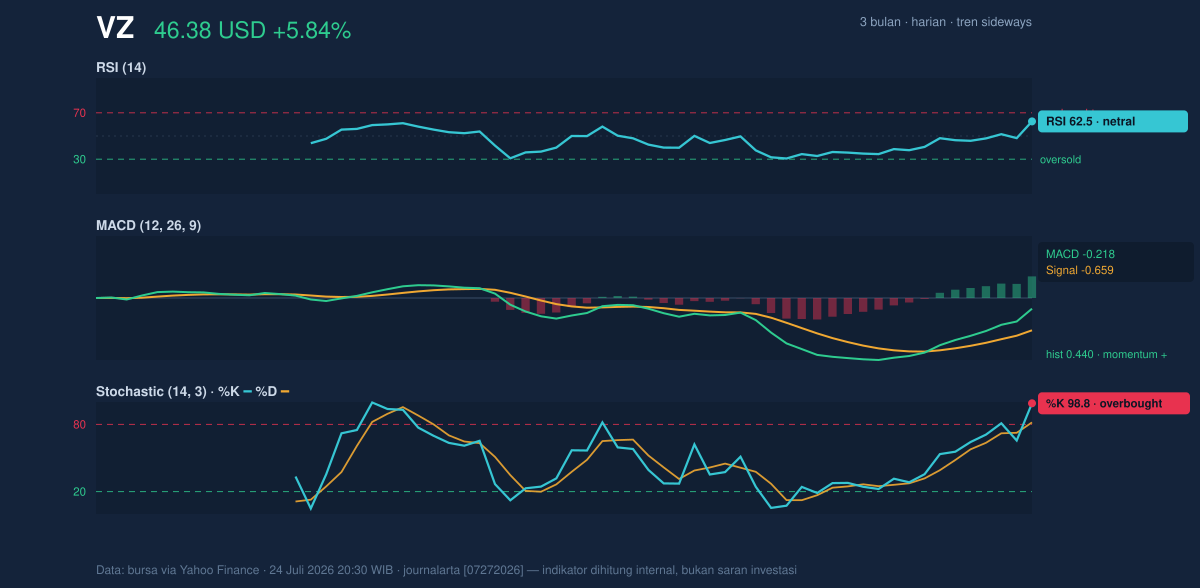
The sharper warning comes from the Stochastic reading, where %K is 98.8 and %D is 81.8. That combination is typically read as overbought, meaning the stock has risen quickly relative to its recent trading range and may need to pause or consolidate before it can extend further. In plain language, the market has already done a lot of the near-term buying.
The MACD tells a more supportive story. With MACD at -0.218, signal at -0.659, and a histogram of 0.440, momentum is positive because the MACD line is above the signal line and the gap is favorable. This matters more than the negative absolute MACD reading: it suggests the direction of momentum has improved, even if the broader trend has not fully escaped its slower structure.
Volatility & Volume
The Bollinger setup reinforces the idea that the stock is pressing the upper edge of its current channel. The upper band is 45.85, the middle band is 43.31, and the lower band is 40.77, while %B at 110% shows the price has moved beyond the upper band. That is often a sign of strength, but it can also mean the move has run ahead of itself in the short term.
The band width is 11.7%, which is described as normal, so this is not a classic squeeze waiting to explode. Instead, it suggests the stock is already in a functioning range where the next move will likely depend on whether buyers can keep volume behind the breakout attempt.
Volume supports that idea. The latest turnover was 40,742,900, compared with a 20-session average of 34,751,335, or 1.2× normal. That is not euphoric volume, but it is enough to show participation. The rising OBV, or on-balance volume, adds weight to the move because it indicates trading flow is accumulating rather than fading.
ATR, a measure of typical daily movement, stands at 1.16, or 2.5% of price. That places volatility in the moderate zone, meaning the stock can still move meaningfully in a session, but not in the kind of erratic fashion that usually accompanies stress.
Key Levels & Scenarios
The nearest reference points are clear on the chart. Support at 41.99 is the first line that matters if the current advance stalls, while resistance at 46.54 is the immediate barrier the stock is testing now. Because the last price of 46.38 is already at 96% of the recent range, the market is effectively knocking on resistance rather than sitting comfortably below it.
If VZ can clear 46.54 and hold above it, the chart would begin to argue that the stock is transitioning from a range-bound rebound into a more durable upside push. If it fails to hold the area near 41.99, the recent strength would look more like a short-lived overshoot, especially given the overbought Stochastic reading.
Technical Verdict: HOLD (wait & see)
HOLD (wait & see) fits the data best because the stock is showing improving momentum, but it is also pressing resistance with overbought short-term signals.
- MACD histogram at 0.440 and the line above the signal suggest momentum is still positive.
- Price above SMA20 at 43.31 and SMA50 at 45.46 shows the stock has regained its shorter-term averages.
- Stochastic at 98.8/81.8 warns that the move is stretched and could pause near resistance.
Verdict invalidated if price breaks below 41.99, where the nearest support would fail and the rebound case would weaken.
- Ideal Entry Range: 43.31 to 45.46
- Exit Target: 46.54, with the next chart reference near 48.96
- Stop Loss protection: below 41.99
For non-traders, that means Verizon has improved, but the stock is still close enough to resistance that the market has not yet proved the rally can keep going. “The next few sessions will tell us whether this is a real breakout or just a fast climb into a crowded corner.”
Summary Data VZ
| Last price | 46.38 USD |
| Change 1 day / 5 days / 1 month | 5.84% / 6.40% / 0.67% |
| Trend / MA-cross | sideways / none |
| SMA20 / SMA50 | 43.31 / 45.46 |
| RSI (14) / Stochastic %K | 62.5 / 98.8 |
| Bollinger %B / ATR | 110% / 1.16 |
| Support / Resistance 20 days | 41.99 / 46.54 |
| Data as of | 24 Juli 2026 20:30 WIB |



