AstraZeneca Stock Drops 1.70%, Momentum Gains In Focus
On Juli 31, 2026: price 12,720.00 GBp, trend downtrend, RSI 50.0, support 12,364.00, resistance 14,538.00. technical analysis of astrazeneca stock.

AstraZeneca shares on the London Stock Exchange fell to 12,720.00 GBp from 12,940.00 in the latest session, a 1.70% drop that leaves the stock back below both its short- and medium-term trend markers, according to data via Yahoo Finance. The move matters because it comes after a modest 0.14% gain over five days, suggesting the recent bounce has not yet changed the broader picture. The shares remain in a downtrend, with the SMA20 at 13,127.10 still above the market and the SMA50 at 13,458.04 sitting even higher, a classic sign that sellers still control the wider structure.
Trend & Price Action
The chart shows AstraZeneca trading below its SMA20 and SMA50, which is important because moving averages often act like a market memory. When price sits underneath them, rallies tend to meet resistance rather than attract fresh follow-through. There is no new MA cross, so this is not a fresh trend reversal signal. Instead, the stock is still trying to stabilise inside a weaker setup.
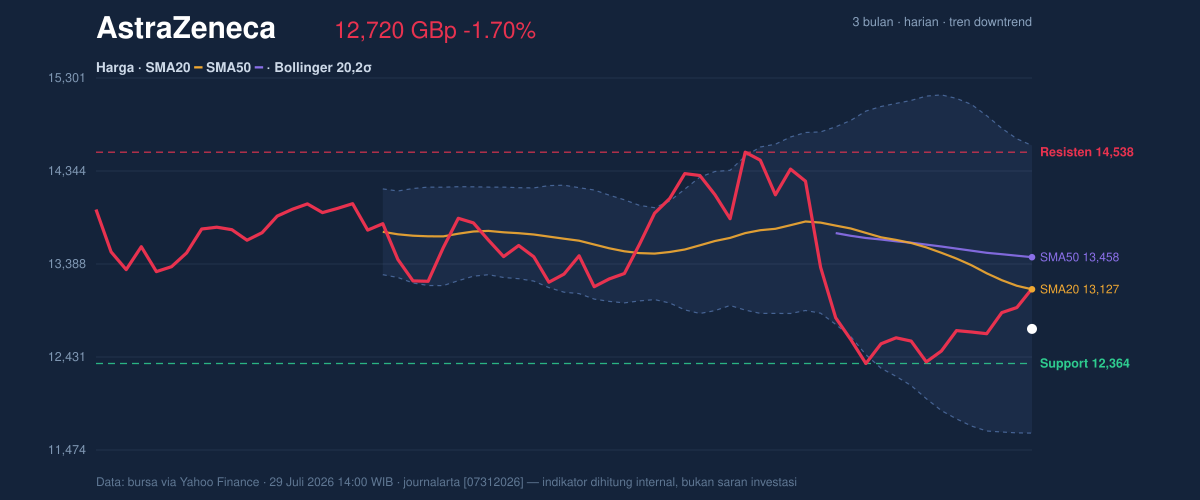
The price also sits in the lower part of its recent range. It is only 16% of the way up from the 20-hour support at 12,364.00 toward the 20-hour resistance at 14,538.00, which tells readers the shares are much closer to a floor than a ceiling, but not yet convincingly rebounding from that floor. That matters because range position often hints at which side of the market is currently winning. The 3-month high at 15,126.00 remains far away, while the 3-month low at 9,892.00 shows there is still a wide historical band beneath current levels if weakness deepens.
Oscillators & Momentum
Momentum is mixed rather than cleanly bearish. The RSI(14) at 50.0 is neutral, which means the stock is neither stretched nor washed out on that measure. In plain language, RSI around 50 often signals a market that has paused rather than committed to a strong directional move. That neutrality is offset by the Stochastic %K at 92.0 and %D at 82.1, which are both in overbought territory. Stochastic tends to react faster than RSI, so this combination suggests the recent short-term bounce may be getting tired.
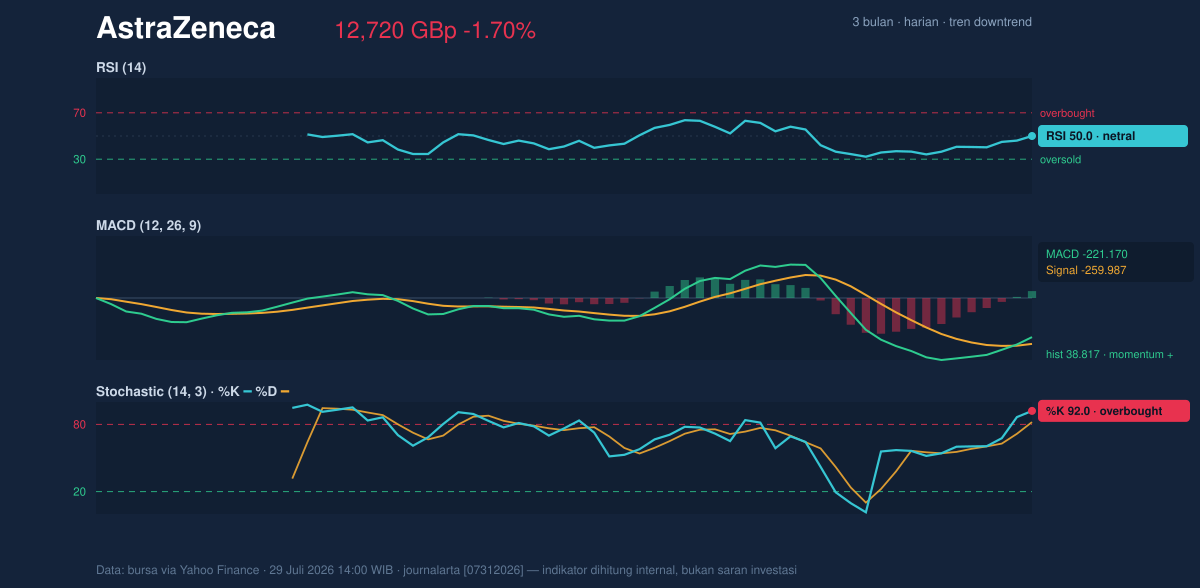
The MACD at -221.170 remains below zero, which keeps the broader momentum picture cautious, but the signal line at -259.987 and histogram at 38.817 show the gap is narrowing. That is a positive momentum shift, even if it has not yet produced a full trend change. In practical terms, the stock is still in a weak trend, but the rate of decline is easing. Traders often watch this kind of divergence closely because it can precede either a base-building phase or a fresh selloff if price fails to confirm.
Volatility & Volume
Volatility is elevated. The Bollinger Band width of 22.5% is described as expanding, and the ATR(14) at 653.22 equals 5.1% of the share price, both of which point to larger-than-normal daily swings. That matters because a wider band and higher ATR usually mean the stock can move quickly in either direction, especially around support and resistance. The %B at 36% places price in the lower half of the Bollinger envelope, which is consistent with a market that is weak but not yet at the lower band at 11,647.71.
Volume adds an important clue. The latest session saw 5,212,609 shares trade, almost 1.9× the 20-hour average of 2,748,060. That is not a quiet drift lower; it is a move with participation. Rising volume during a decline can mean distribution, where investors are using strength to reduce exposure. Yet OBV is rising, which suggests some buyers are still accumulating on dips. The result is a tug-of-war: sellers still own the trend, but buyers have not disappeared.
Key Levels & Scenarios
The nearest important floor is 12,364.00. If that level gives way, the stock would be moving into a weaker technical pocket, and the lower Bollinger band at 11,647.71 becomes the next reference point. On the upside, the first meaningful test is the SMA20 at 13,127.10, followed by the SMA50 at 13,458.04. A move back above those averages would be more convincing than a single intraday bounce, because it would show the shares have regained the short-term trend line and are challenging the medium-term one.
The upper range marker at 14,538.00 is the clearest resistance level shown in the data. If price can reclaim that area, it would suggest the recent weakness is being absorbed rather than extended. For now, though, the stock is still trading below the trend averages, while momentum remains split between a neutral RSI and an overbought stochastic reading.
Technical Verdict: HOLD (wait & see)
HOLD (wait & see)
- The downtrend is still intact because price is below the SMA20 at 13,127.10 and SMA50 at 13,458.04.
- The MACD histogram at 38.817 shows improving momentum, but the Stochastic at 92.0/82.1 is already overbought, so near-term upside may be stretched.
- Volume at 5,212,609 and OBV rising show participation, but the stock has not yet reclaimed the moving averages that would confirm a stronger turn.
- Invalidation: this verdict is invalidated if price falls below 12,364.00.
- Ideal Entry Range: 12,364.00 to 13,127.10
- Exit Target: 13,458.04 to 14,538.00
- Stop Loss protection: below 11,647.71
In plain English, the shares are not in a clean recovery yet, but they are also not showing a decisive breakdown right this minute.
The latest trade was 12,720.00 GBp.
Summary Data AstraZeneca
| Last price | 12,720.00 GBp |
| Change 1 day / 5 days / 1 month | -1.70% / 0.14% / -8.19% |
| Trend / MA-cross | downtrend / none |
| SMA20 / SMA50 | 13,127.10 / 13,458.04 |
| RSI (14) / Stochastic %K | 50.0 / 92.0 |
| Bollinger %B / ATR | 36% / 653.22 |
| Support / Resistance 20 days | 12,364.00 / 14,538.00 |
| Data as of | 29 Juli 2026 14:00 WIB |



