INTC Stock Gains 2.61%, Momentum Gains In Focus
On September 14, 2026: price 102.94 USD, trend sideways, RSI 57.4, support 87.26, resistance 106.24. technical analysis of intc stock. INTC Stock Gains — full…

Intel is trading higher, but the signal is not a clean breakout; it is a move into the upper part of its recent range, where momentum looks firmer than the trend itself. On NASDAQ, INTC last changed hands at 102.94 USD, up 2.61% on the day and 12.29% over five days, even as the one-month move remains -1.55%. That mix matters for international readers: it suggests the stock has recovered quickly from weakness, yet the broader tape still shows a market that is testing conviction rather than confirming a new long-term direction.
Trend & Price Action
The chart shows a stock that is trading above its short- and medium-term averages, but not yet in a decisive trend regime. Price is above the SMA20 at 94.61 and also above the SMA50 at 98.35, which means recent buyers have pushed Intel back into a stronger technical position than it held a few weeks ago. Still, the trend label remains sideways, and that is a useful signal in itself: the market is not yet rewarding the stock with a sustained directional structure, only a recovery inside a broad band.
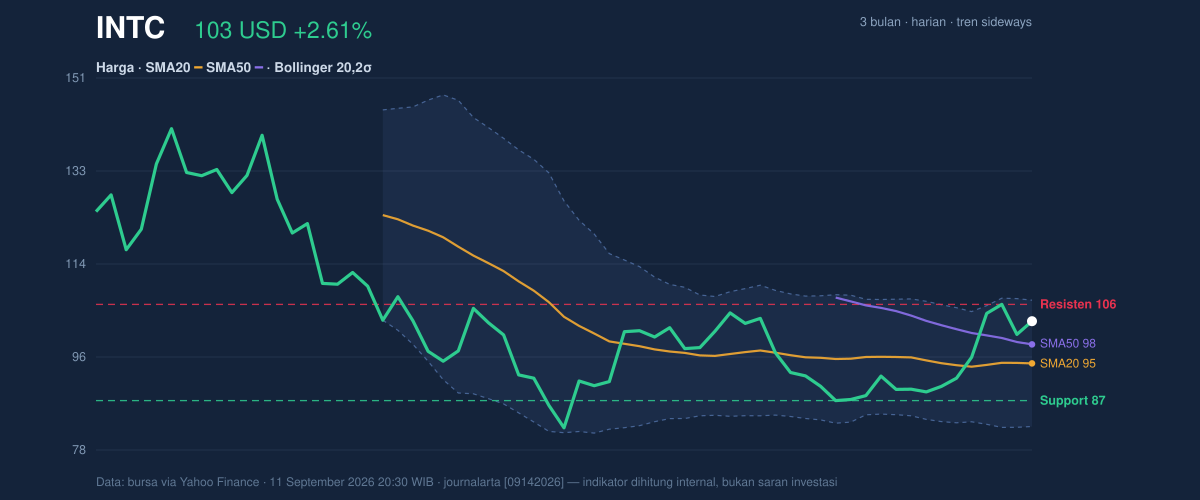
The absence of a fresh MA-cross also keeps the picture restrained. A moving-average cross is often read as a trend-change signal, but without one, the current advance is better understood as a rebound within an existing range. That is reinforced by the stock’s placement in the band structure: Intel is sitting near the upper end of its 20-hour range, with support at 87.26 and resistance at 106.24. At 83% of the range, the price is close to the upper boundary, which tends to increase the importance of resistance rather than support in the immediate session.
The broader three-month frame adds context. Intel’s 3-month high is 142.35 and the 3-month low is 81.79. That wide span shows how much room the stock has had to travel, and why a single strong week should not be mistaken for a completed trend reversal. The latest move is constructive, but the chart still asks for follow-through.
Oscillators & Momentum
Momentum indicators are more positive than the trend label, and that gap is the central story. RSI at 57.4 is neutral, which means the stock is neither stretched nor washed out on this measure. In plain language, RSI is not warning of exhaustion yet, but it is also not flashing a powerful trend signal. That leaves room for continuation, though not without risk of hesitation near resistance.
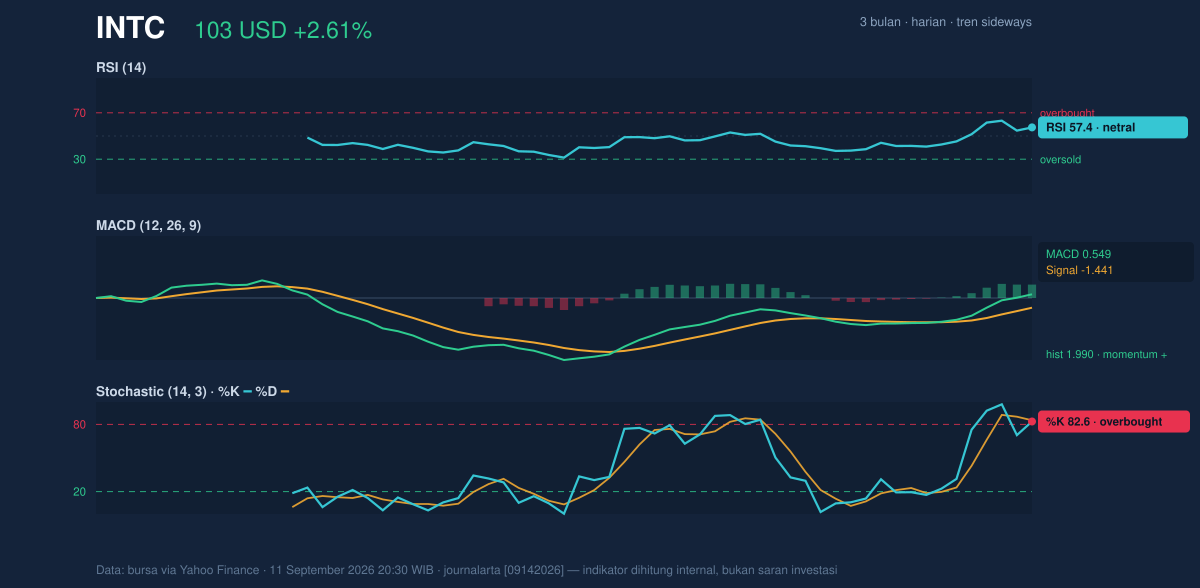
The sharper signal comes from the stochastic oscillator. Stochastic %K at 82.6 and %D at 83.7 are overbought, meaning the stock has risen fast enough that short-term momentum is extended. Overbought does not automatically mean reversal, but it often means the pace of gains may slow unless fresh demand appears. In a sideways market, that matters: overbought readings near the top of a range can precede pauses or pullbacks.
By contrast, MACD is positive at 0.549, with the signal line at -1.441 and a histogram of 1.990. The MACD setup signals that upward momentum is currently stronger than the longer-term baseline, and the positive histogram shows that the gap is expanding in favor of bulls. In practical terms, this is the clearest evidence that the recent rise is not just noise. It is real participation, even if the broader trend has not yet flipped into a fully directional advance.
Volatility & Volume
Volatility is elevated, and that changes how traders read each move. The Bollinger Bands are widening, with the upper band at 107.07, the middle band at 94.61, and the lower band at 82.14. A widening band usually means the market expects larger swings, not calmer trading. Intel’s %B of 83% shows the price is trading high within that band structure, which is consistent with strength but also with a market that may be getting closer to short-term stretch.
The ATR(14) is 4.58, or 4.4% of price, which confirms that daily movement can be meaningful. For readers unfamiliar with ATR, it is a measure of typical trading range; a higher reading means stop levels and breakout levels matter more because the stock can move quickly. That is especially relevant here because the latest volume came in at 86,840,900, below the 20-hour average of 91,699,110, or about 0.9x normal. Price is rising, but participation is not yet decisively stronger than average.
That said, OBV is rising, and that is an encouraging background signal. On-balance volume tracks whether volume tends to accumulate on up days or down days. A rising OBV suggests buyers have been more persistent than sellers over time, even if the latest session did not arrive with exceptional turnover. In other words, the move has support, but not yet the kind of heavy-volume confirmation that typically accompanies a major breakout.
Key Levels & Scenarios
The immediate technical map is clear. Resistance at 106.24 is the first barrier, and the upper Bollinger band at 107.07 sits just above it, creating a tight zone where the stock may either stall or prove that the move has real force. On the downside, support at 87.26 is the first major floor, while the Bollinger middle band at 94.61 and the SMA20 at 94.61 act as a nearer pivot. That alignment is important: when the moving average and band midpoint sit together, they often become the market’s first reference point on any pullback.
If Intel clears 106.24 and holds above the upper band, the chart would suggest that the recent rebound is extending into a stronger phase. If it fails there, the overbought stochastic reading raises the odds of a pause back toward the 94.61 area. A drop through that midpoint would not break the broader structure immediately, but it would weaken the case that buyers remain in control of the current swing.
Technical Verdict: HOLD (wait & see)
HOLD (wait & see) is the cleanest reading because the stock has positive momentum, but it is also near resistance and showing overbought short-term signals.
- Reason 1: MACD is positive and the histogram is expanding, which supports the recent advance.
- Reason 2: Price is above SMA20 and SMA50, showing recovery strength, but the broader trend is still sideways.
- Reason 3: Stochastic is overbought and the price is near resistance at 106.24, so upside may need a fresh catalyst to continue cleanly.
- Invalidation: the verdict is invalidated if price falls below 94.61, the Bollinger middle band and SMA20 pivot.
- Ideal Entry Range: 94.61 to 98.35
- Exit Target: 106.24 to 107.07
- Stop Loss Protection: 87.26
For non-traders, that means Intel has improved, but the chart still needs proof that this rise can hold before it turns into something more durable.
The latest volume was 86,840,900, below the 91,699,110 average.
Summary Data INTC
| Last price | 102.94 USD |
| Change 1 day / 5 days / 1 month | 2.61% / 12.29% / -1.55% |
| Trend / MA-cross | sideways / none |
| SMA20 / SMA50 | 94.61 / 98.35 |
| RSI (14) / Stochastic %K | 57.4 / 82.6 |
| Bollinger %B / ATR | 83% / 4.58 |
| Support / Resistance 20 days | 87.26 / 106.24 |
| Data as of | 11 September 2026 20:30 WIB |



