TMUS Momentum Weakens: Stock Gains 2.92% (September 14, 2026)
On September 14, 2026: price 182.33 USD, trend sideways, RSI 51.2, support 177.16, resistance 188.02. technical analysis of tmus stock.

International investors watching T-Mobile US are seeing a stock that is not breaking down, but is also not yet breaking free. The shares finished at 182.33 dollars on NASDAQ, up 2.92% from the prior close of 177.16, yet the broader message from the chart is one of compression rather than conviction.
T-Mobile’s tape, as shown in the chart, sits in a narrow technical corridor. The price is above the SMA20 at 181.65 and just above the SMA50 at 181.84, which tells traders the stock is holding short-term and medium-term trend lines, but only by a slim margin. That matters because when price hovers so close to both moving averages, the market is signaling balance: buyers are defending the line, but they are not forcefully extending it. The sideways trend and the tiny 0.15%/5-day slope in the SMA20 reinforce that reading. There is no fresh moving-average cross, so the chart is lacking the kind of structural shift that usually marks a new trend phase.
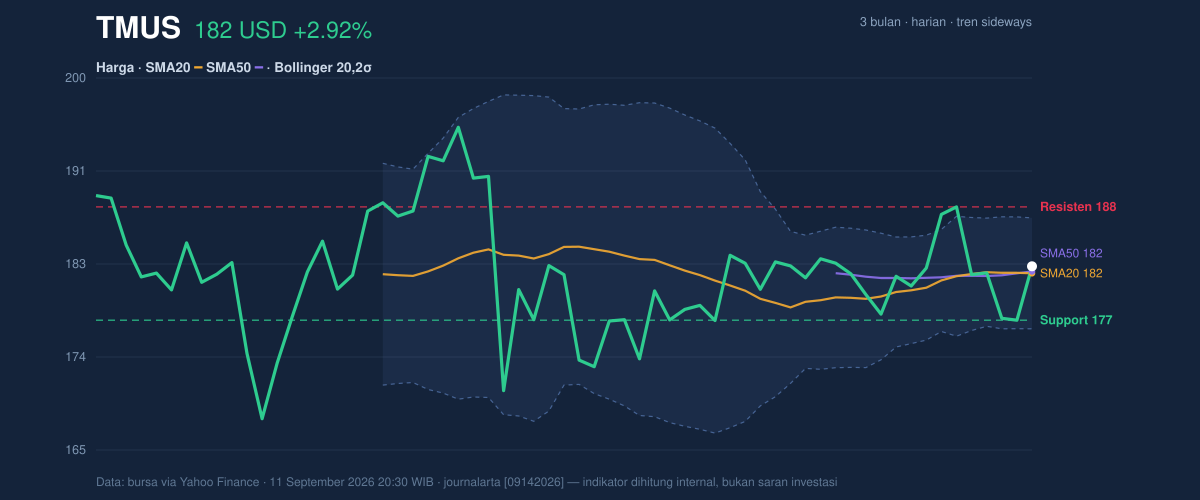
The price is also sitting at roughly the middle of the recent range, with support at 177.16 and resistance at 188.02. That placement, at 48% of the range, is important because it suggests the market has not chosen a direction yet. It is closer to the center of the battlefield than to either edge. In practical terms, that means the next move will likely be defined less by the day’s gain and more by whether the stock can absorb overhead supply near resistance or lose the floor that buyers have been defending near support. The broader three-month range, from 165.66 to 198.86, shows the stock has room on both sides, but it has not been able to reclaim the upper half of that band with any consistency.
The volatility setup adds a second layer to that story. Bollinger Bands are tightening, with the upper band at 186.96, the middle band at 181.65, and the lower band at 176.34. The 5.8% band width indicates a squeeze, which often means the stock is storing energy for a larger move. That does not predict direction by itself, but it does warn that the current calm may not last. The fact that price is sitting at %B 56% means it is only slightly above the middle of the band structure, not stretched into overbought territory. In plain language, the stock is not overheated; it is coiled.
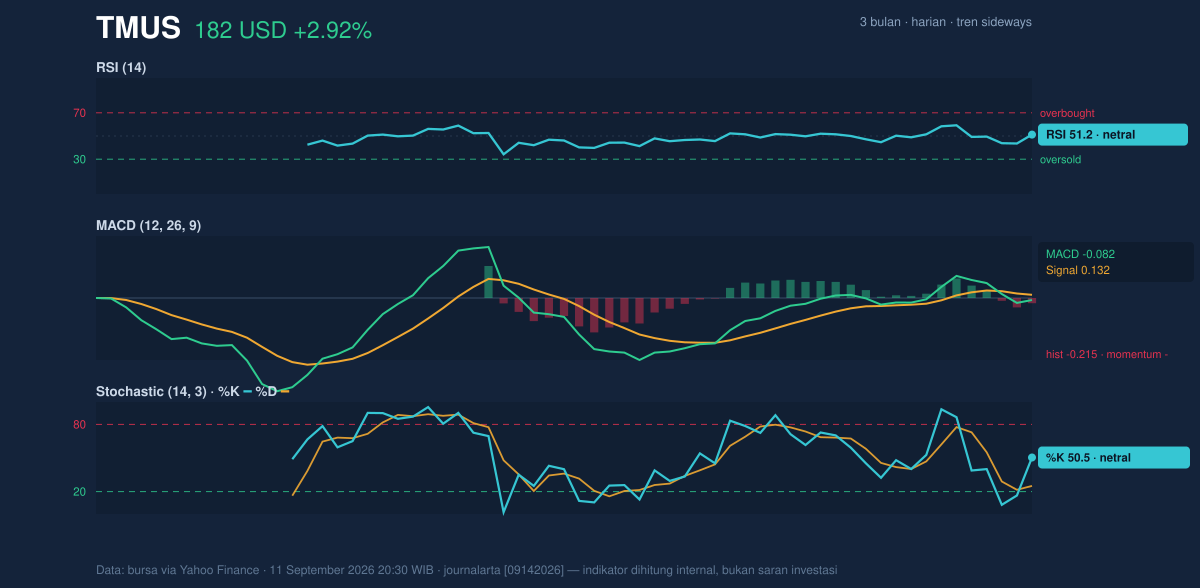
Momentum, however, is softer than price action. The RSI at 51.2 is neutral, which means the stock is neither strongly bought nor strongly sold. The Stochastic at 50.5 / 25.1 also points to a neutral setup, but with a slight hint that the faster line has improved from lower levels. That can matter when a stock is trying to stabilize, because Stochastic often turns before price does. Still, the more important signal is the MACD: -0.082 versus a signal line of 0.132, with a -0.215 histogram. That configuration shows negative momentum, meaning recent price movement is still weaker than the trend baseline. In other words, even though the shares are holding above key averages, the internal push behind the move is not yet fully repaired.
Volume offers a modest counterweight. Last trading volume was 3,675,000, below the 20-day average of 3,993,125, or about 0.9x normal. Lower-than-average volume on a rebound can mean two different things: either the market is quietly absorbing supply, or the move lacks broad conviction. The OBV is rising, which is the more constructive clue. OBV, or on-balance volume, tracks whether volume is flowing into the stock on up days or out of it on down days. A rising OBV suggests accumulation is happening underneath the surface, even if the headline volume is not yet dramatic. That is why the recent gain should be read as tentative but not empty.
The key test is simple. If T-Mobile can push through 188.02, the chart would begin to look like a squeeze resolving upward, with the upper Bollinger band at 186.96 already close enough to act as a launch zone. If instead the stock loses 177.16, the current stabilization would weaken quickly, and the market would likely revisit the lower Bollinger band at 176.34. Because the ATR is 4.30, or 2.4% of price, moves of that size are not unusual; they are the sort of daily swings the stock can absorb without changing character. That means a break in either direction would be meaningful, not just noise.
Technical Verdict: HOLD (wait & see)
HOLD (wait & see) is the clearest technical read because price is holding above both the SMA20 and SMA50, but MACD remains negative and momentum is still only neutral on RSI and Stochastic.
The Bollinger squeeze suggests a larger move may be coming, yet the chart has not confirmed direction.
OBV rising is constructive, but volume is still below average, so participation is not fully convincing.
- Ideal Entry Range: 181.65 to 177.16, where the SMA20, SMA50, and support cluster converge.
- Exit Target: 186.96 to 188.02, using the upper Bollinger band and nearby resistance as the first technical ceiling.
- Stop Loss protection: below 176.34, which would mean the lower Bollinger band and support area are failing.
- Verdict invalidated if price falls below 177.16 and cannot recover quickly.
For non-traders, this means the stock is stable enough to watch, but not yet strong enough to call a clean trend change.
The next decisive signal is whether T-Mobile can close beyond 188.02 or slip back under 177.16.
Summary Data TMUS
| Last price | 182.33 USD |
| Change 1 day / 5 days / 1 month | 2.92% / -3.03% / -0.57% |
| Trend / MA-cross | sideways / none |
| SMA20 / SMA50 | 181.65 / 181.84 |
| RSI (14) / Stochastic %K | 51.2 / 50.5 |
| Bollinger %B / ATR | 56% / 4.30 |
| Support / Resistance 20 days | 177.16 / 188.02 |
| Data as of | 11 September 2026 20:30 WIB |



