HD Stock Gains 1.00%, Testing Support Level In Focus
On September 14, 2026: price 308.74 USD, trend downtrend, RSI 32.5, support 305.69, resistance 344.30. technical analysis of hd stock. HD Stock Gains — full…

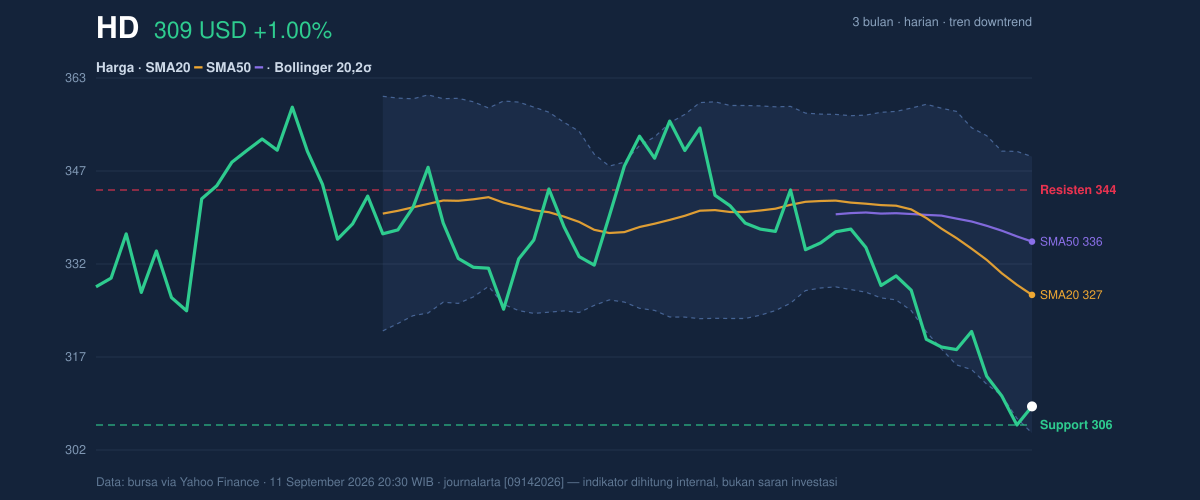
Home Depot shares on the NYSE were last quoted at 308.74 USD, up 1.00% from the previous close of 305.69, but the bigger signal in the data is that the stock is still trading well below its short- and medium-term trend lines, with price under both the SMA20 at 327.07 and the SMA50 at 335.83. That matters because it shows the rebound is happening inside a broader downtrend rather than against it: the 20-day average is still sloping lower at -2.77% over 5 days, which means recent rallies have not yet been strong enough to reverse the prevailing pressure. As shown in the chart, the stock is also sitting near the lower edge of its Bollinger band structure, suggesting the market is still pricing in caution rather than renewed momentum.
The price action is especially notable because Home Depot is now only a little above the 304.36 lower Bollinger band and just above the 305.69 20-hour support, leaving the shares in the lower part of the recent range. In plain terms, the market has not broken down, but it has not reclaimed control either. The stock is positioned at about 8% of its 20-hour range, which tells us sellers have dominated most of the recent window and buyers are only beginning to test whether that floor can hold. The 3-month range reinforces the point: at 308.74, the stock remains much closer to the 304.30 low than to the 358.85 high, so this is still a recovery attempt inside a larger pullback.
Trend & Price Action
The trend structure is still negative. Price below the SMA20 and SMA50 usually means the market is trading under both its short-term and intermediate cost bases, so many holders are still sitting on losses and may use strength to reduce exposure. The absence of a fresh MA-cross also matters: there is no new moving-average turn to suggest a clean trend reversal. In technical terms, this is not a breakout pattern; it is a stock trying to stabilize after a slide. The fact that the lower Bollinger band is at 304.36 and the share price is close to that level means the market is testing whether downside momentum is exhausting itself. If the stock can recover back toward the 327.07 middle band, that would signal a more credible shift from defense to consolidation.
That has not happened yet.
Oscillators & Momentum
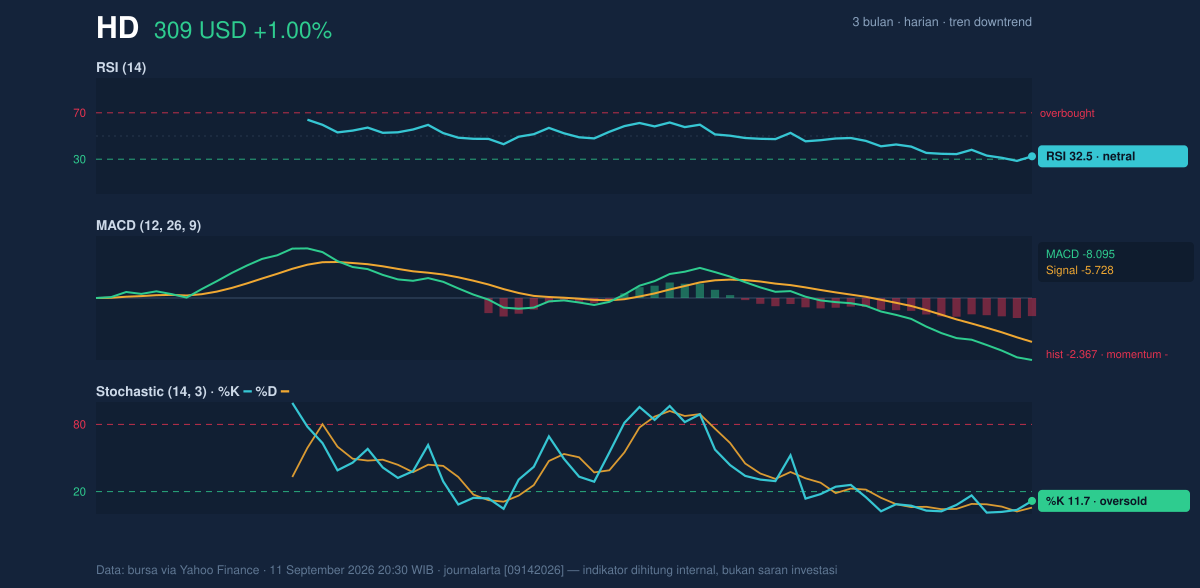
Momentum is mixed, but the balance still leans negative. The RSI at 32.5 is described as neutral, but it is close to the oversold zone, which means the stock is weak enough that sellers have had the upper hand, though not so weak that it has entered a full capitulation reading. More telling is the Stochastic %K at 11.7 and %D at 5.8, which is oversold. Stochastic measures where price sits within its recent range, so readings this low often mean the stock is stretched on the downside and vulnerable to a bounce if selling pressure eases. But that is only a setup, not confirmation.
The MACD at -8.095, below its signal line at -5.728, with a -2.367 histogram, says downside momentum is still active. MACD is a trend-following gauge, so when it remains below the signal line, the market is still losing altitude even if short-term oscillators are oversold. As shown in the chart, this creates a divergence of sorts: the stock is technically stretched, but the trend has not yet turned. That combination often produces sharp rebounds or continued choppy weakness, depending on whether support holds.
Volatility & Volume
Volatility is moderate rather than extreme, with ATR(14) at 5.82, or 1.9% of price. ATR, or average true range, indicates the typical daily movement size; here it suggests the stock can still move meaningfully, but not in a disorderly way. The Bollinger band width of 13.9% is described as normal, so this is not a squeeze waiting to explode, nor is it a panic expansion signaling forced liquidation. The market is simply drifting lower with enough room for abrupt short-term moves if a catalyst appears.
Volume does not yet confirm a bottoming process. Last volume was 3,488,800, below the 3,902,730 20-day average, or about 0.9× normal. Lower-than-average volume on a bounce usually means conviction is limited; buyers are present, but not forceful enough to signal a decisive change in participation. The OBV, or on-balance volume, is also falling, which means trading flow has been favoring distribution over accumulation. In simple terms, the chart is not yet showing that larger investors are stepping in with sustained demand.
Key Levels & Scenarios
For now, the key battle line is the 305.69 support, with the next reference point being the 304.36 lower Bollinger band and the 304.30 3-month low. Those levels cluster tightly, so a failure there would suggest the current stabilization attempt has given way to another leg lower. On the upside, the first meaningful hurdle is the 327.07 SMA20, then the 335.83 SMA50, and above that the 344.30 resistance. Reclaiming the 20-day average would matter because it would show price has climbed back above the level where recent trading has been centered; clearing the 50-day average would be a stronger sign that the stock is no longer trapped beneath medium-term pressure.
If price holds above 305.69 and starts pushing back toward 327.07, the message would be that the oversold reading is turning into a tradable rebound. If it slips below 304.36 and then 304.30, the chart would be confirming that the recent weakness has not yet finished.
Technical Verdict: HOLD (wait & see)
- Reason 1: Price is still below the SMA20 at 327.07 and SMA50 at 335.83, so the broader trend remains under pressure.
- Reason 2: Stochastic is oversold and RSI at 32.5 is close to oversold, which raises the odds of a bounce but does not confirm one.
- Reason 3: MACD remains negative and OBV is falling, showing momentum and participation still favor sellers.
- Verdict invalidated if price falls below 304.30, which would break the 3-month low and the nearby support cluster.
Ideal Entry Range: 304.36 to 305.69, where support and the lower Bollinger band cluster.
Exit Target: 327.07 first, then 335.83 if the recovery extends back to the moving averages.
Stop Loss protection: below 304.30, since that would break the 3-month low and weaken the support base.
In plain English: the stock is weak but stretched, so the chart is waiting for proof that support can hold before any rebound can be trusted.
The next visible test is whether Home Depot can defend 305.69 while traders watch for a move back toward the 327.07 20-day average.
Summary Data HD
| Last price | 308.74 USD |
| Change 1 day / 5 days / 1 month | 1.00% / -2.93% / -9.65% |
| Trend / MA-cross | downtrend / none |
| SMA20 / SMA50 | 327.07 / 335.83 |
| RSI (14) / Stochastic %K | 32.5 / 11.7 |
| Bollinger %B / ATR | 10% / 5.82 |
| Support / Resistance 20 days | 305.69 / 344.30 |
| Data as of | 11 September 2026 20:30 WIB |



