Visa Stock Gains 0.88% Today, Momentum Weakens
On September 14, 2026: price 370.45 USD, trend sideways, RSI 50.8, support 358.84, resistance 384.14. technical analysis of visa stock.

Visa’s shares rose to 370.45 on the NYSE, up 0.88% from the previous close, but the move sits inside a broader pause rather than a clean breakout. The stock is still trading below its 20-day average of 372.96 while staying above the 50-day average of 365.23, a combination that usually signals a market that has not chosen a direction yet. In plain terms: the longer trend is still intact, but short-term buyers have not fully regained control.
Trend & Price Action
As shown in the chart, Visa is moving in a sideways trend, and the slope of the SMA20 at 0.50% over 5 days suggests only a mild upward tilt rather than strong follow-through. That matters because a flat or gently rising short-term average often reflects consolidation after a prior advance, not a fresh acceleration. The absence of a new MA-cross also reinforces that message: the trend structure has not delivered a decisive signal.
The stock is also sitting in the middle of its recent range. It is priced at 46% of the 20-hour range, with support at 358.84 and resistance at 384.14. That positioning tells traders neither side has won the tape. The market is close enough to support to attract dip buyers, but still far enough below resistance that momentum traders have not been able to force a clean test of the top of the range.
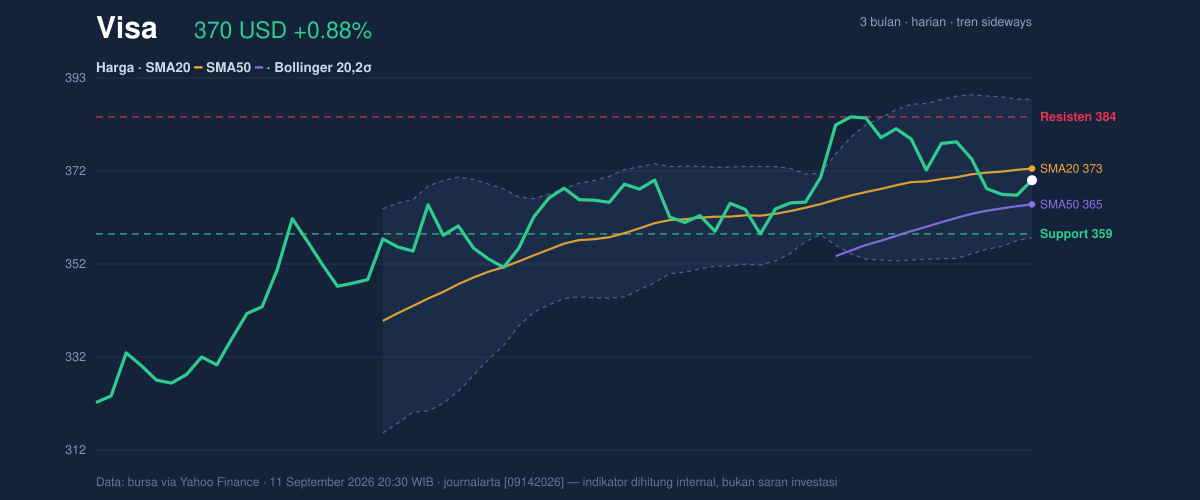
The broader context is equally important. Visa’s 3-month high is 385.57 and the 3-month low is 319.80, so the current price is much closer to the upper end of that band. That usually means the market is still carrying the memory of strength, but it also leaves less room for complacency if short-term support gives way.
Oscillators & Momentum
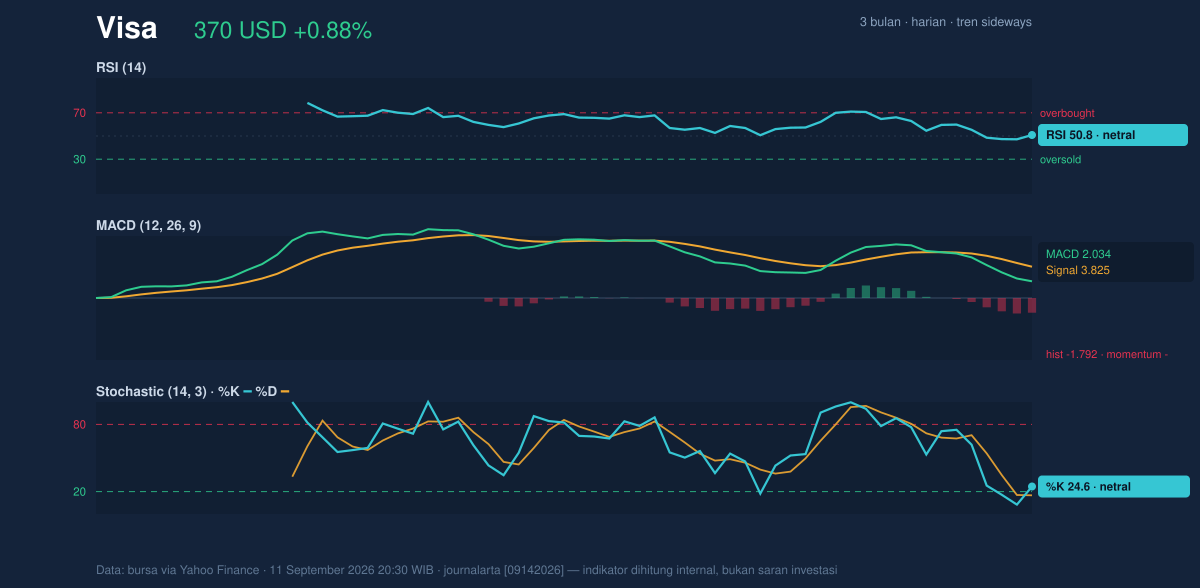
The momentum picture is mixed, and that is the key signal. The RSI at 50.8 is neutral, which means the stock is neither overbought nor oversold. In practical terms, RSI around 50 often marks a battleground: buyers and sellers are roughly balanced, and price direction will likely depend on whether one side can add volume and conviction.
The Stochastic %K at 24.6 and %D at 16.7 is also neutral, but it leans toward the lower end of the range. That can hint at a stock that has cooled enough to stabilise, yet it is not a strong reversal signal on its own. The more telling reading is the MACD histogram at -1.792, with MACD at 2.034 below the signal line at 3.825. That setup means near-term momentum is still negative even though the broader trend has not broken down.
In other words, the stock is not weak enough to call damaged, but it is not strong enough to call confirmed. The oscillators are basically saying the same thing as the price structure: patience is winning over urgency.
Volatility & Volume
Visa’s Bollinger Bands are not signaling a squeeze or a breakout setup. The band width is 8.0%, described as normal, and %B is 42%, which places the price below the middle band at 372.96. That is a useful detail because it shows the stock is trading in the lower half of its short-term volatility envelope. It is not stretched to the upside, and it is not pinned to the lower band either, so the market still has room to move without immediately becoming technically overheated.
The volatility reading is moderate. ATR(14) is 5.67, or about 1.5% of price, which implies a typical daily move that is sizeable enough to matter but not wild. For readers, ATR is a measure of how much a stock tends to move in a day; a mid-range reading like this suggests that any break from the current band could travel with some speed once confirmed.
Volume is the softer point in the chart. Last volume was 3,492,700, well below the 20-day average of 6,259,435, or about 0.6x normal activity. That matters because price moves on light volume are often less convincing. The OBV is falling, which means cumulative volume flow is not supporting the price as strongly as bulls would want. When price holds up but volume flow weakens, the market is often telling you that buyers are present, but not yet committed.
Key Levels & Scenarios
The immediate map is straightforward. Support at 358.84 is the first line to watch, and it sits just above the Bollinger lower band at 358.03. That clustering makes the area technically important: if price slips through that zone, the chart would likely shift from range-bound to vulnerable. On the upside, resistance at 384.14 comes before the 3-month high at 385.57, so a move through that pocket would be the first sign that the stock is trying to retest the top of its recent range.
A clean break above resistance would also improve the momentum profile, especially if it comes with stronger volume and a turn in the MACD histogram. If instead the stock fails to hold support, the neutral RSI and weak MACD would become more important, because they would suggest the current consolidation is resolving lower rather than resetting for another advance. As the chart shows, the market is balanced, but not evenly powered.
Technical Verdict: HOLD (wait & see)
HOLD (wait & see)
- RSI at 50.8 is neutral, so there is no strong momentum edge either way.
- MACD histogram at -1.792 shows momentum is still negative even though the broader trend is sideways.
- Volume at 0.6x average and a falling OBV mean the latest price strength lacks strong participation.
Verdict invalidated if price falls below 358.84, because that would break first support and put the lower Bollinger band at 358.03 in play.
- Ideal Entry Range: 358.84 to 372.96
- Exit Target: 384.14 to 385.57
- Stop Loss protection: below 358.03
For non-traders: the chart says Visa is stable, but it has not yet proved it can leave this range behind.
Summary Data Visa
| Last price | 370.45 USD |
| Change 1 day / 5 days / 1 month | 0.88% / -2.19% / 1.37% |
| Trend / MA-cross | sideways / none |
| SMA20 / SMA50 | 372.96 / 365.23 |
| RSI (14) / Stochastic %K | 50.8 / 24.6 |
| Bollinger %B / ATR | 42% / 5.67 |
| Support / Resistance 20 days | 358.84 / 384.14 |
| Data as of | 11 September 2026 20:30 WIB |



