HSBC Stock Gains 2.49%, Testing Key Resistance In Focus
On Juli 31, 2026: price 1,587.00 GBp, trend uptrend, RSI 68.5, support 1,445.20, resistance 1,552.80. technical analysis of hsbc stock.

HSBC Holdings’ 1,587.00 GBp share price on the London Stock Exchange on 29 July 2026 sits just below its 3-month high of 1,590.00, after a 2.49% daily gain and a 10.18% rise over one month. The move keeps the stock firmly in an uptrend, but the chart now shows a market that has run ahead of some short-term momentum gauges: price is extended above trend support, volume has jumped to 1.6× the 20-day average, and yet the on-balance volume line has fallen, a sign that participation has not fully confirmed the latest push higher. In plain terms, HSBC is trading strong, but the latest advance is beginning to look stretched rather than effortless.
Trend & Price Action
As shown in the chart, HSBC remains above both its SMA20 at 1,493.64 and SMA50 at 1,434.14, which is the clearest sign that the broader trend still points upward. The SMA20 slope of 1.93% over 5 days matters because it shows the short-term trend is not just positive, but accelerating. That is more meaningful than a simple “price above average” reading: it suggests buyers have been willing to pay progressively higher levels rather than merely defending an old base. There is no fresh moving-average cross to flag a new phase, so the message from the chart is continuity, not a breakout from a long consolidation.
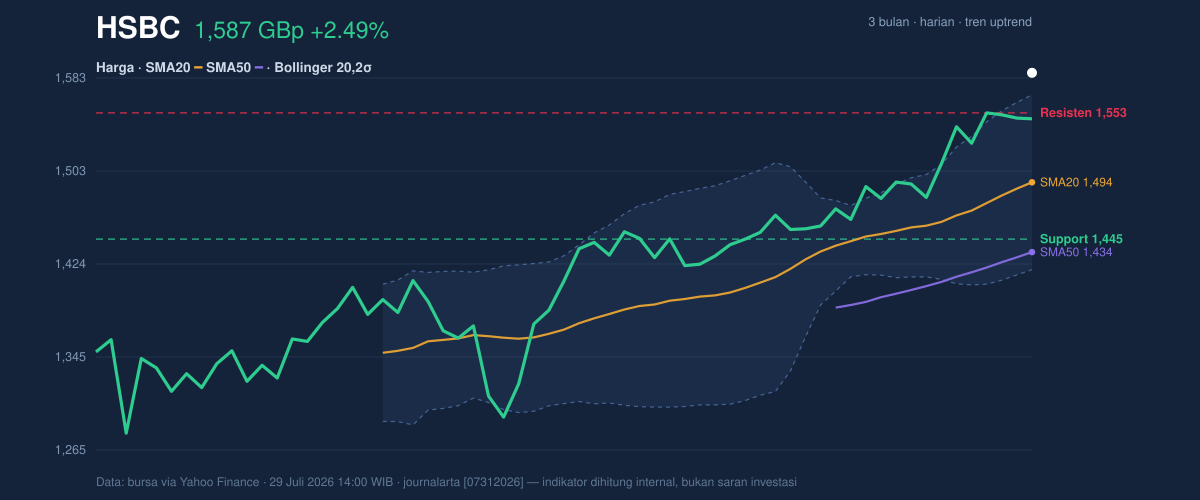
Still, the stock is no longer trading near the middle of its recent range. With price at 132% of the 20-hour range and only a small gap below the 3-month high of 1,590.00, the market is pressing against the upper edge of recent history. That is usually bullish, but it also means the next move depends less on trend direction and more on whether buyers can keep absorbing supply near highs.
Oscillators & Momentum
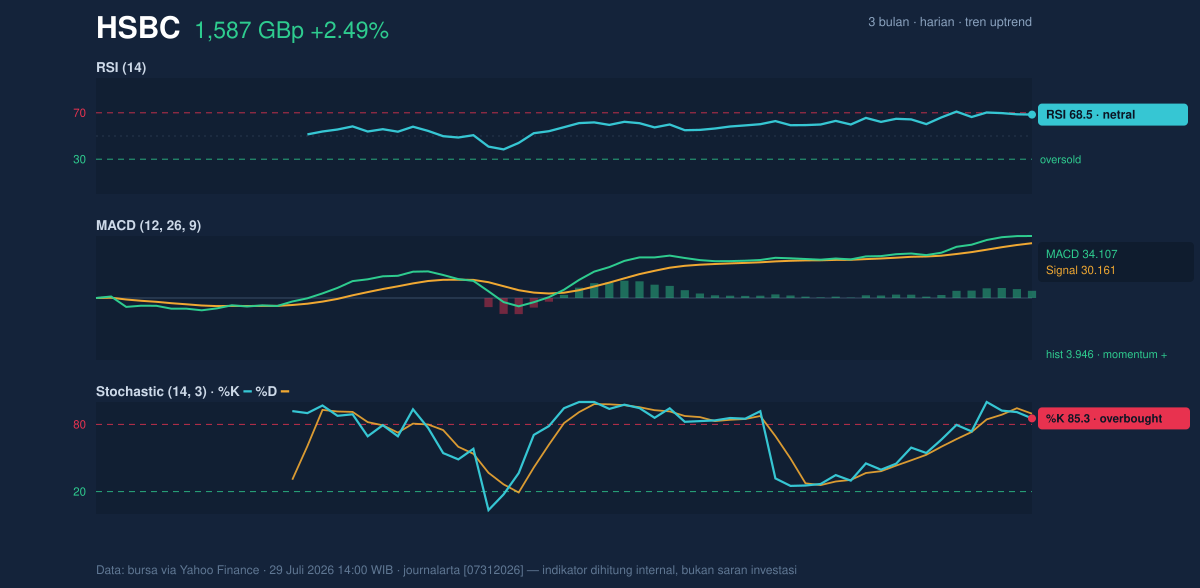
The momentum picture is more mixed than the price trend. RSI at 68.5 is still technically neutral, but it is close enough to the overbought zone to show the rally is mature. More importantly, the Stochastic %K at 85.3 and %D at 89.5 are both overbought, which means the short-term pace of gains has become extended and may be vulnerable to a pause or pullback. That does not automatically signal reversal; in strong trends, oscillators can stay elevated for a while. But it does tell readers that upside is now being chased rather than quietly accumulated.
The more constructive signal comes from MACD at 34.107 above its signal line at 30.161, with a positive histogram of 3.946. In technical terms, MACD measures whether momentum is strengthening or fading; here, it says the rally still has underlying force. The tension is that MACD is supportive while Stochastic is stretched, which often means the trend is intact but the next leg may need a reset before extending further.
Volatility & Volume
Volatility is contained rather than explosive. The Bollinger Band width of 10.0% is normal, and ATR at 36.26 equals 2.3% of price, indicating moderate day-to-day movement. That combination matters because a stock trading near its highs with only moderate volatility can continue trending if demand remains steady; it is not flashing the kind of panic-like expansion that often accompanies a blow-off top. At the same time, %B at 113% shows price is trading above the upper Bollinger band, which is a classic sign of extension. In practical language, the stock has outrun its recent average range.
Volume adds another layer. Last session’s volume of 32,209,405 was well above the 20-hour average of 19,740,946, so the move was not thin or illiquid. That is supportive on the surface. Yet OBV is down, and that divergence is important: it suggests the latest rise has not been matched by a clean accumulation trend. When price rises but OBV falls, it can mean the advance is being driven by fewer committed buyers, or that selling pressure is being absorbed without broad participation. Either way, it is a caution flag for the sustainability of the breakout attempt.
Key Levels & Scenarios
As shown in the chart, the most immediate technical reference is the resistance at 1,552.80, which price has already cleared; that level now becomes the first area to watch for a retest. Below that sits support at 1,445.20, which is also close to the SMA20 at 1,493.64 and the Bollinger middle band at the same level. That cluster is important because it marks the zone where the trend would need to prove itself again if the stock cools off. If HSBC holds above that band, the uptrend remains orderly. If it slips back through it, the market would be telling us the recent extension was too far, too fast.
The nearest upside reference is the 3-month high of 1,590.00. A sustained move above that level would confirm that the stock is not merely testing resistance but entering fresh price discovery. Failure to hold above the mid-band area would instead point to a consolidation phase, with the upper Bollinger band and recent highs acting more like a ceiling than a launch point.
Technical Verdict: HOLD (wait & see)
HOLD (wait & see) — the trend is positive, but the stock is technically stretched and the momentum mix is no longer clean.
- MACD is positive, which supports the broader uptrend.
- Stochastic is overbought and %B is 113%, both pointing to extension above the recent range.
- OBV is down, so the latest price advance is not fully confirmed by participation.
The verdict is invalidated if price falls below 1,445.20.
- Ideal entry range: 1,493.64 to 1,445.20
- Exit target: 1,590.00
- Stop loss protection: below 1,445.20
For non-traders, this means HSBC is still strong, but the chart is asking for proof that the rally can continue without losing momentum.
HSBC’s next technical test is whether it can stay above 1,587.00 GBp and hold its ground near the 1,590.00 3-month high.
Summary Data HSBC
| Last price | 1,587.00 GBp |
| Change 1 day / 5 days / 1 month | 2.49% / 2.99% / 10.18% |
| Trend / MA-cross | uptrend / none |
| SMA20 / SMA50 | 1,493.64 / 1,434.14 |
| RSI (14) / Stochastic %K | 68.5 / 85.3 |
| Bollinger %B / ATR | 113% / 36.26 |
| Support / Resistance 20 days | 1,445.20 / 1,552.80 |
| Data as of | 29 Juli 2026 14:00 WIB |



