CVX Stock Technicals Today: Gains 2.35%, Golden Cross Formed
On Agustus 3, 2026: price 196.83 USD, trend uptrend, RSI 67.1, support 168.10, resistance 196.83. technical analysis of cvx stock. CVX Stock Technicals — full…

Chevron’s shares on the NYSE climbed to 196.83 USD, up 2.35% from the previous close of 192.31, extending a one-month advance of 16.33% as the stock pushed to the top of its recent trading range, according to Yahoo Finance data for 31 July 2026, 20:30 WIB. The move matters because it is not just a one-day pop: Chevron is now trading above both its short- and medium-term trend lines, which tells investors the market is still rewarding the shares for sustained buying rather than a brief rebound.
Trend & Price Action
The chart shows Chevron in a clear upward structure, with price sitting above the SMA20 at 185.34 and the SMA50 at 182.75. That matters because moving averages act like a crowd’s memory of fair value: when the price stays above them, it usually means buyers are willing to pay more than the recent average, a sign of trend strength. The golden cross — where the 20-day average crosses above the 50-day average — reinforces that message, suggesting the shorter-term momentum has overtaken the longer trend. The SMA20 slope of 3.30% over 5 days adds a second layer of confirmation: the trend is not only positive, it is accelerating.
Chevron is also trading at the very edge of its short-term range, with resistance at 196.83 and a 3-month high of 198.87. In plain terms, the stock is pressing against a ceiling that has recently capped further gains. That usually brings a test of conviction: if buyers can keep absorbing supply near the highs, the move can continue; if not, the stock often pauses or pulls back toward nearby support.
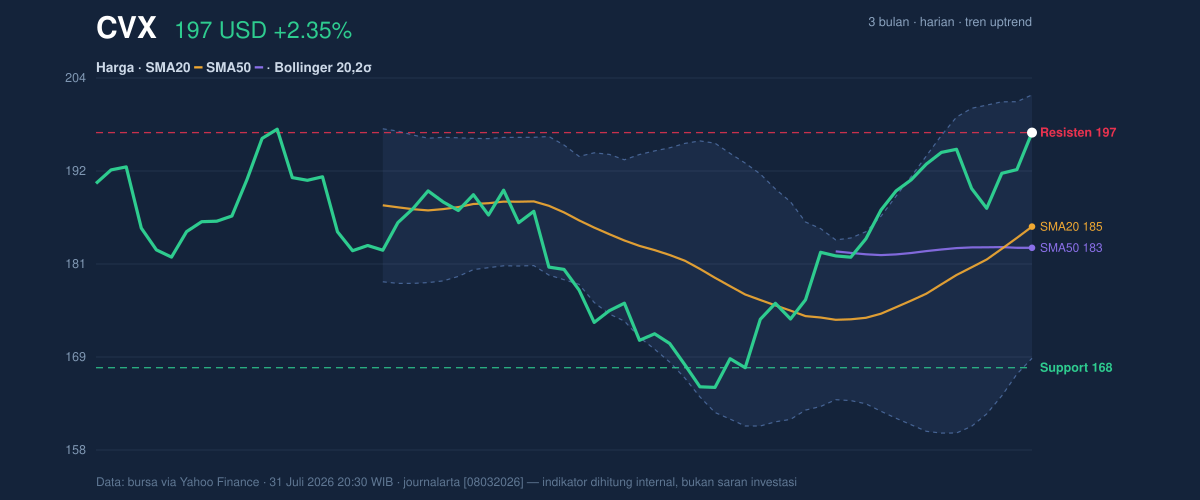
A short distance from the top, but not yet beyond it.
Oscillators & Momentum
The momentum picture is more nuanced than the trend picture. The RSI at 67.1 is described as neutral in the data, but it sits close to the commonly watched overbought zone, which means the stock has already done a lot of work in the short term and may need fresh catalysts to keep climbing at the same pace. The Stochastic %K at 95.5 and %D at 81.1 are more stretched, and that is the clearest warning sign in the set: Stochastic measures where the price sits within its recent range, so readings this high usually mean the stock is closing near the top of that range and may be vulnerable to a near-term pause. That does not automatically mean reversal; it means the move has become extended.
The MACD at 4.039 above its signal line at 3.005, with a histogram of 1.034, still points to positive momentum. MACD is useful here because it captures whether trend acceleration is improving or fading. The positive histogram says the uptrend remains intact, even if it is becoming more mature. In other words, the stock is still moving with the trend, but the oscillators are starting to show that the pace may not be sustainable without a brief reset.
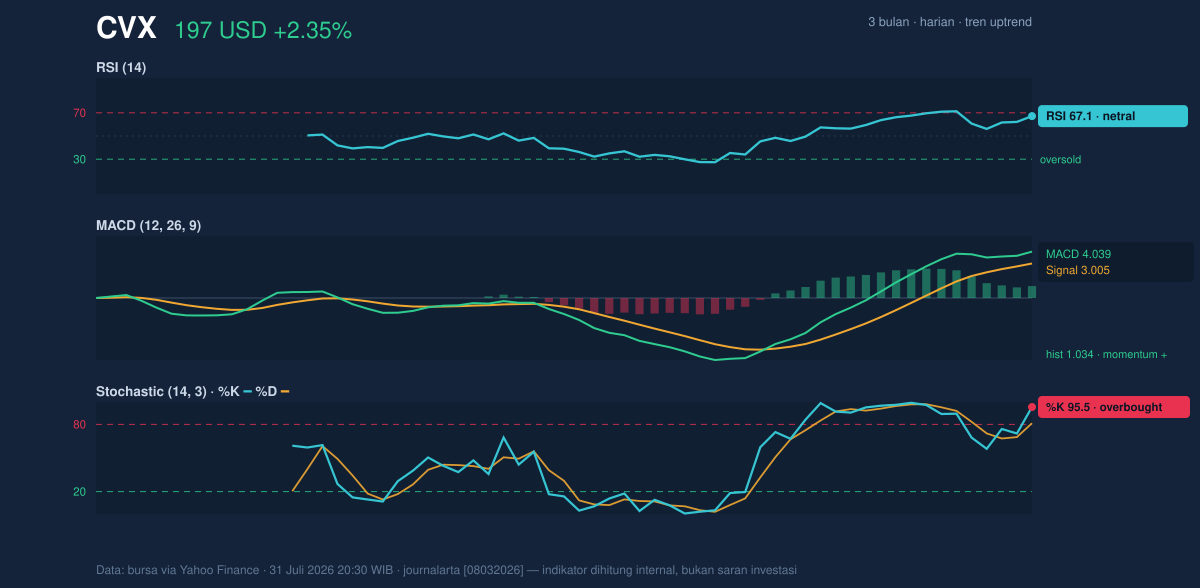
Momentum is strong, but it is no longer fresh.
Volatility & Volume
Volatility is moderate rather than explosive, with ATR(14) at 4.14, equal to 2.1% of price. ATR, or average true range, is a gauge of how much the stock typically moves in a day; this reading suggests Chevron has room to swing, but not in a disorderly way. The Bollinger Band width of 17.4% is described as normal, which implies the stock is not in a volatility squeeze that often precedes a sharp breakout. Instead, the bands suggest a more established trend that is being tested near the upper band at 201.44. With %B at 86%, price is trading closer to the top of the band than the middle, a sign that the market is leaning bullish but may be a bit crowded on the upside.
Volume adds an important confirmation. Last session’s 9,928,700 shares traded were about 1.3× the 20-day average of 7,590,855, and OBV is rising. That combination matters because rising price on heavier-than-normal participation suggests the move is being accepted by the market rather than driven by a thin trade. OBV, or on-balance volume, tracks whether volume is accumulating on up days; a rising line supports the idea that demand is broadening.
Key Levels & Scenarios
The clearest support in the data sits at 168.10, while the near-term ceiling remains 196.83, with the broader upper reference at 198.87. If Chevron can move through the current resistance zone and stay above the upper Bollinger band at 201.44, the chart would show an expansion in bullish control. If it fails to hold the recent highs, the first area to watch is the SMA20 at 185.34, which now acts as a trend gauge: holding above it would keep the uptrend intact, while a drop below it would suggest the rally is losing momentum. The more important structural floor remains 168.10, because a break there would unwind much of the recent range-based strength.
Technical Verdict: HOLD (wait & see)
HOLD (wait & see)
- Golden cross and price above the SMA20/SMA50 support the trend.
- MACD remains positive and volume is running at 1.3× normal, which confirms participation.
- Stochastic is overbought and price is pressing against resistance at 196.83, so upside may need a pause before extending.
Verdict invalidated if price breaks below 168.10.
- Ideal Entry Range: 185.34 to 196.83
- Exit Target: 198.87 to 201.44
- Stop Loss Protection: 168.10
For non-traders: the chart still points upward, but the stock is close to a short-term ceiling, so the next move matters more than the last one.
Summary Data CVX
| Last price | 196.83 USD |
| Change 1 day / 5 days / 1 month | 2.35% / 1.05% / 16.33% |
| Trend / MA-cross | uptrend / golden |
| SMA20 / SMA50 | 185.34 / 182.75 |
| RSI (14) / Stochastic %K | 67.1 / 95.5 |
| Bollinger %B / ATR | 86% / 4.14 |
| Support / Resistance 20 days | 168.10 / 196.83 |
| Data as of | 31 Juli 2026 20:30 WIB |



