MRK Stock Technicals Today: Gains 0.32%, Testing Key Resistance
On Agustus 3, 2026: price 130.20 USD, trend uptrend, RSI 58.7, support 120.78, resistance 131.82. technical analysis of mrk stock. MRK Stock Technicals — full…

Merck is holding near the upper half of its recent trading band, with the shares at 130.20 USD after a 0.32% rise on the day, but the message from the chart is less about speed than staying power. The stock remains in an uptrend, trading above both its SMA20 at 127.32 and SMA50 at 122.86, which tells investors the recent drift has been supported by a broader base rather than a one-day bounce. At the same time, the market is not showing the kind of overheated conditions that often precede a sharp reversal: momentum is positive, but not stretched, and volume has been a touch lighter than usual.
Trend & Price Action
As shown in the chart, Merck is sitting above the short- and medium-term trend lines, a classic sign that buyers have kept control of the tape even after a modest -0.66% move over five days. The SMA20 trending up at 0.45% over five days matters because it signals the recent advance is still being reinforced, not fading. With price above the SMA20 and well above the SMA50, the structure points to continuation rather than breakdown. The absence of a fresh moving-average cross also suggests the trend is already established, so the market is now judging whether Merck can extend toward the top of its range.
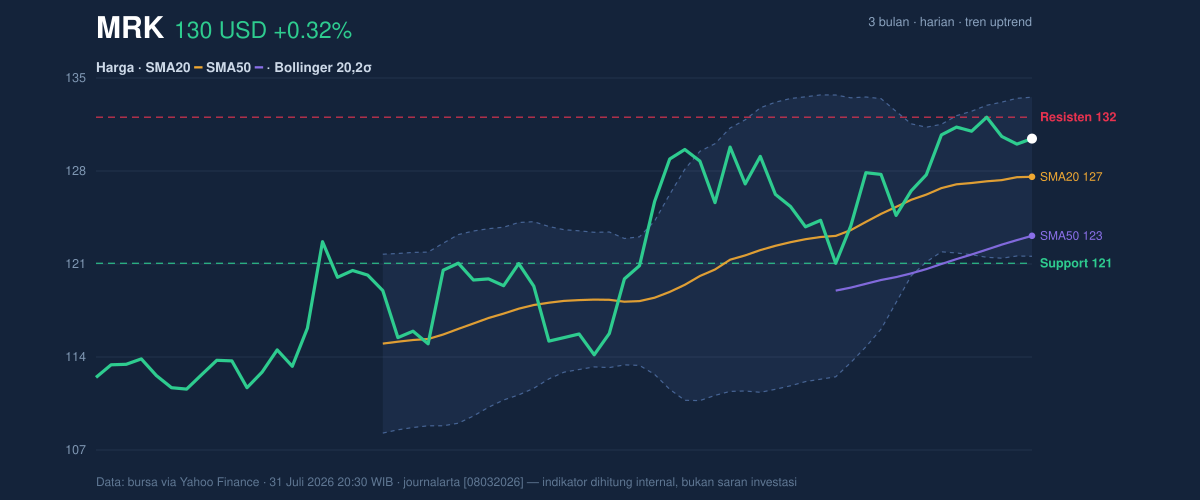
The stock is also trading near the upper part of its 20-hour range, at about 85% of that span, which means the market has already done much of the work needed to reclaim recent highs. That is constructive, but it also leaves less room for error.
A strong position can still become a crowded one.
Oscillators & Momentum
The momentum tools are broadly aligned, but they are not screaming urgency. The RSI at 58.7 is neutral-to-firm, which usually means the stock has room to rise without immediately entering overbought territory. The Stochastic %K at 67.4 and %D at 66.9 also sit in a middle zone, indicating the recent advance has traction but has not yet reached the kind of extreme that often warns of exhaustion. In plain language: buyers are present, but they have not become euphoric.
The most encouraging signal is the MACD at 2.306 above the signal line at 2.225, with a positive histogram of 0.081. MACD measures whether shorter-term price strength is outrunning the longer trend; when it sits above the signal line, it usually means upward momentum is still intact. The histogram being positive, even if modestly so, confirms that momentum is still expanding rather than rolling over. That said, the gap is not wide, so this is a supportive signal rather than a forceful one.
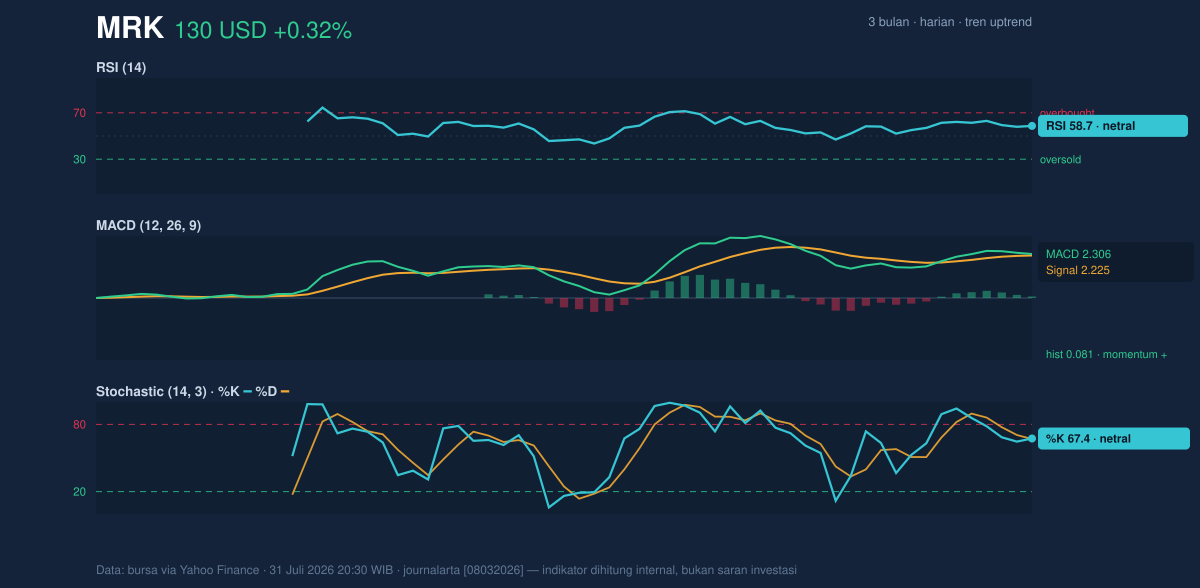
This is a market that is moving forward, but with measured steps.
Volatility & Volume
The Bollinger Bands help frame how stretched the stock is. Merck’s price is below the upper band at 133.33 and above the middle band at 127.32, with %B at 74%. That usually means the stock is trading in the upper portion of its volatility envelope, but not pressing against an obvious breakout edge yet. The 9.4% band width is described as normal, which suggests the stock is not in a volatility squeeze that might foreshadow a sharp expansion. Instead, the current setup looks orderly: price is advancing inside a stable channel rather than coiling for a dramatic move.
ATR adds a similar message. At 3.38, or 2.6% of price, daily movement is moderate. That matters because it tells readers not to expect explosive swings as the base case. If Merck pushes beyond resistance, the move may still be steady rather than violent; if it slips, the decline may also unfold in controlled fashion unless volume accelerates.
Volume is the one place where confirmation is a bit softer. The latest 7,731,900 shares traded below the 20-day average of 8,574,805, or about 0.9x normal. Lower participation can mean the move is not yet widely endorsed by the market. Still, the OBV is rising, which is important: on-balance volume tracks whether buying pressure is accumulating over time, and a rising OBV often means demand is improving even when the latest session’s volume is not exceptional.
The chart is saying “constructive,” not “crowded.”
Key Levels & Scenarios
The immediate map is clear. Near-term support sits at 120.78, while near-term resistance is 131.82. Merck’s current price is sitting close to the upper end of that band, so the market is effectively testing whether recent strength can translate into a clean push through resistance. Above that, the Bollinger upper band at 133.33 and the 3-month high at 135.05 form the next visible overhead markers. On the downside, the 3-month low at 110.75 is the broader floor that defines the longer swing range.
If Merck clears 131.82, the chart suggests room to challenge the 133.33 Bollinger ceiling and then the 135.05 high. If it fails to hold above 127.32, the middle Bollinger band and SMA20, the tone would shift from constructive to fragile, because that would mean the stock is losing the short-term trend support that has been guiding the advance.
Technical Verdict: HOLD (wait & see)
HOLD (wait & see) is the cleanest reading because the trend is positive, but the stock is also sitting close to resistance with only moderate momentum confirmation.
- Reason 1: Price is above the SMA20 at 127.32 and SMA50 at 122.86, so the trend remains intact.
- Reason 2: MACD is positive and the histogram is above zero, showing momentum still leans upward.
- Reason 3: Volume is below average, so the latest push lacks strong participation, while price is already near resistance at 131.82.
- Verdict invalidated if price falls below 120.78, the nearest support, because that would weaken the current structure.
- Ideal Entry Range: 127.32 to 120.78
- Exit Target: 131.82 to 133.33
- Stop Loss protection: below 120.78
In plain English: Merck still looks technically healthy, but it is close enough to resistance that the market is waiting for proof before the next leg is confirmed.
Summary Data MRK
| Last price | 130.20 USD |
| Change 1 day / 5 days / 1 month | 0.32% / -0.66% / 0.49% |
| Trend / MA-cross | uptrend / none |
| SMA20 / SMA50 | 127.32 / 122.86 |
| RSI (14) / Stochastic %K | 58.7 / 67.4 |
| Bollinger %B / ATR | 74% / 3.38 |
| Support / Resistance 20 days | 120.78 / 131.82 |
| Data as of | 31 Juli 2026 20:30 WIB |


