UOB Stock Drops 1.09%, Momentum Weakens In Focus
On Agustus 3, 2026: price 43.40 SGD, trend uptrend, RSI 59.6, support 40.52, resistance 44.95. technical analysis of uob stock. UOB Stock Drops — full details…

United Overseas Bank’s shares on SGX slipped to 43.40 SGD on 31 July 2026, down 1.09% from the previous close, but the pullback sits inside a broader uptrend rather than breaking it. The price is still holding above its SMA20 at 43.30 and well above the SMA50 at 40.62, which tells investors the medium-term trend remains constructive even after a one-day fade. As shown in the chart, UOB is trading in the upper part of its recent range, with price sitting around 65% of the 20-day band and not far below the 20-day resistance at 44.95. That positioning matters: it suggests the market is still willing to pay near the top of the range, but not yet ready to force a clean breakout.
Trend & Price Action
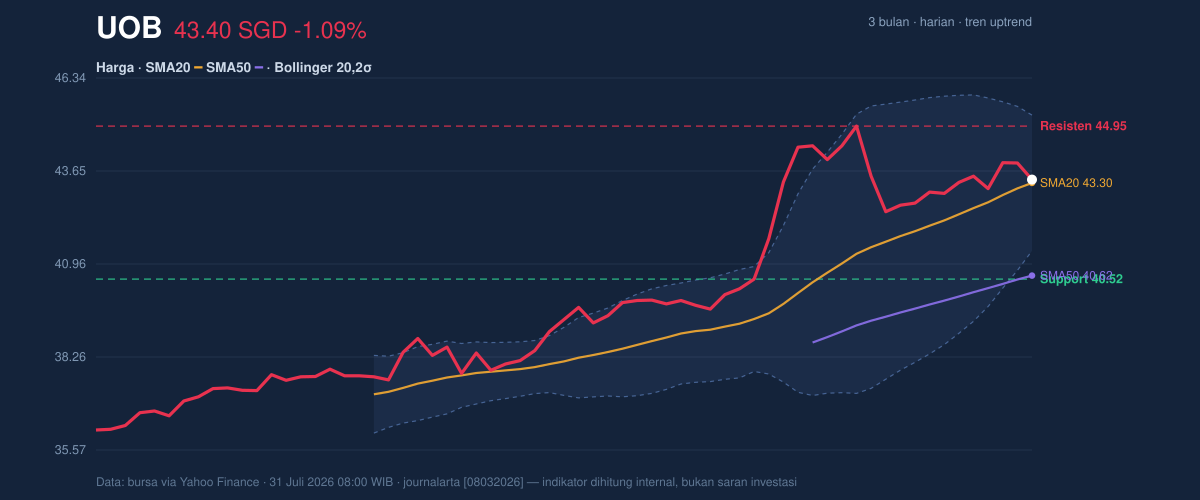
The stock’s trend structure is still tilted higher, helped by the SMA20 slope of 2.15% over 5 days. In plain terms, the short-term trend line is rising, so recent buying pressure has been strong enough to pull the average upward. The lack of a fresh MA-cross means the chart is not flashing a new trend regime; instead, it is showing an established uptrend that is being tested, not reversed. That distinction is important because a stock can drift lower for a day or two without damaging the larger setup, especially when it remains above both moving averages. The 1-month gain of 7.85% and the move to within reach of the 3-month high at 45.15 reinforce that the market has already repriced UOB higher over a longer window.
Oscillators & Momentum
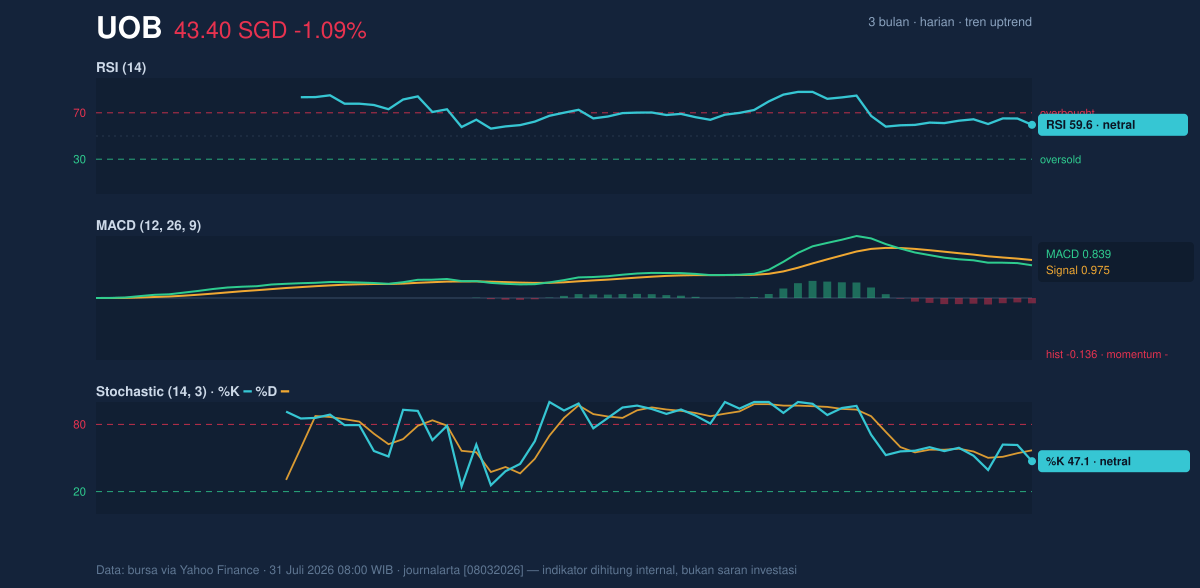
Momentum is more mixed than the trend. The RSI at 59.6 is neutral, which means the shares are not overbought and still have room to extend if fresh demand returns. The Stochastic %K at 47.1 versus %D at 56.9 is also neutral, but it leans softer in the near term because %K sits below %D, a common sign that the latest push has lost some speed. The clearest caution comes from the MACD reading of 0.839 against a signal line of 0.975 and a histogram of -0.136. For general readers, that means the trend is still positive on the broader chart, but the short-term momentum has slipped below its own benchmark, often a sign that buyers are pausing rather than pressing. This is not a breakdown signal by itself; it is a warning that the next leg higher may need confirmation.
Volatility & Volume
The Bollinger Band picture is steady rather than stretched. Price sits near the middle of the band at %B 52%, with the upper band at 45.27 and lower band at 41.34. That tells us the stock is neither compressed into a breakout-ready squeeze nor overstretched at the top of the channel. The 9.1% band width is normal, which points to orderly trading conditions instead of a volatility shock. Meanwhile, ATR at 0.90, or 2.1% of price, indicates moderate daily movement potential; traders should expect swings, but not the kind of wide gaps usually associated with stress or panic.
Volume adds a constructive layer. The latest turnover of 3,958,200 shares was about 1.1× normal versus the 20-day average of 3,667,188, while OBV is rising. OBV, or on-balance volume, tracks whether volume is flowing into the stock on up days or away from it on down days. A rising OBV alongside an uptrend usually means accumulation is still present, even if the latest price candle is soft. In other words, the market is not showing the kind of volume loss that would normally accompany a clean top.
Key Levels & Scenarios
The immediate battlefield is clear. Support at 40.52 marks the lower edge of the recent 20-day range, while resistance at 44.95 caps the current advance. With price at 43.40, UOB is closer to resistance than support, but not so close that the chart looks exhausted. The SMA20 at 43.30 is a useful pivot as well: staying above it keeps the short-term trend intact, while slipping below it would suggest the recent rise is losing traction. The Bollinger lower band at 41.34 provides a second downside reference if selling accelerates, and the 3-month high at 45.15 is the next obvious ceiling if buyers regain control.
If price can reclaim and hold above 44.95, the chart would start to look like a range breakout attempt, especially if volume stays above average and MACD begins to improve. If it fails to hold 43.30, the market would be signaling that the short-term trend is flattening. A drop through 41.34 would be more serious because it would push the shares into the lower half of the band structure and weaken the current uptrend narrative.
Technical Verdict: HOLD (wait & see)
HOLD (wait & see)
- Trend remains positive: price is above the SMA20 at 43.30 and SMA50 at 40.62, with the short-term average still rising.
- Momentum is cooling: MACD is below signal and the Stochastic is soft, so the chart needs confirmation before the next push.
- Participation is still present: volume is running at 1.1× normal and OBV is rising, which keeps the broader setup intact.
Verdict invalidated if price breaks below 41.34.
- Ideal Entry Range: 43.30 to 41.34
- Exit Target: 44.95 to 45.15
- Stop Loss protection: 40.52
For non-traders, this means the shares still look structurally firm, but the latest momentum slowdown argues for patience until the chart either strengthens above resistance or weakens below support.
Summary Data UOB
| Last price | 43.40 SGD |
| Change 1 day / 5 days / 1 month | -1.09% / 0.18% / 7.85% |
| Trend / MA-cross | uptrend / none |
| SMA20 / SMA50 | 43.30 / 40.62 |
| RSI (14) / Stochastic %K | 59.6 / 47.1 |
| Bollinger %B / ATR | 52% / 0.90 |
| Support / Resistance 20 days | 40.52 / 44.95 |
| Data as of | 31 Juli 2026 08:00 WIB |


