Singtel Stock Analysis: Drops 3.93%, Golden Cross Formed
On Agustus 4, 2026: price 4.40 SGD, trend sideways, RSI 49.4, support 4.37, resistance 4.61. technical analysis of singtel stock. Singtel Stock Analysis — full…

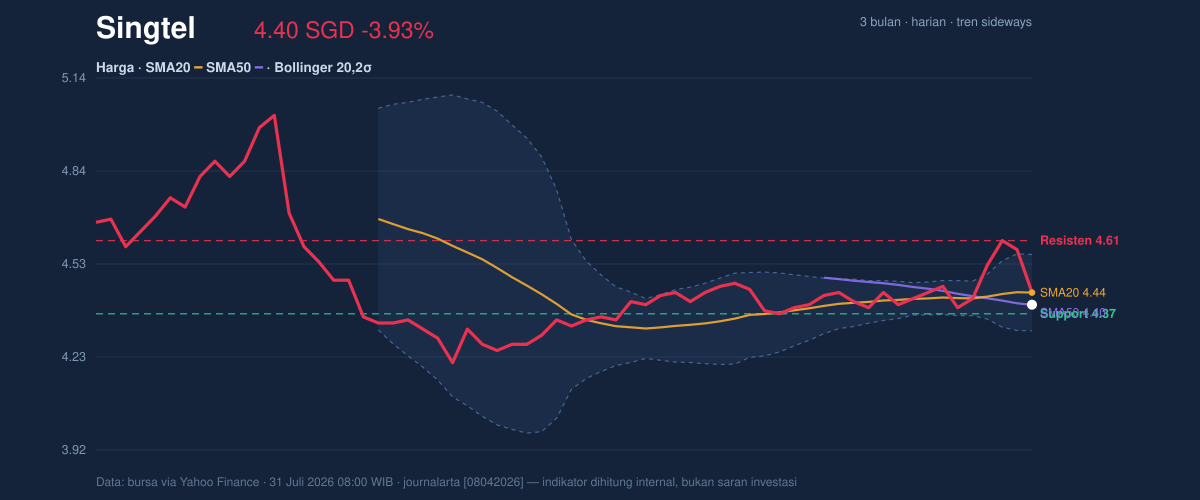
Singapore Telecom (Singtel) fell to 4.40 SGD on SGX by 31 July 2026 08:00 WIB, down 3.93% from the previous close of 4.58, even as the chart still shows a market trying to stabilize rather than break down cleanly. The move matters because the share is sitting almost exactly on its SMA50 at 4.40, while remaining just under the SMA20 at 4.44; that combination usually signals a stock at a decision point, where short-term weakness is meeting a longer trend that has not yet fully rolled over.
Trend & Price Action
The broader structure is sideways, and the slope of the SMA20 at 0.41% over 5 days suggests the recent trend is still nudging upward rather than falling apart. In practical terms, that means sellers have not seized full control, but buyers have also not reclaimed the upper hand. The more important signal is the golden cross, where the SMA20 has moved above the SMA50; that is a medium-term constructive sign because it often marks a shift from consolidation toward recovery, even if the latest price is still trading below the faster average.
The price is also positioned near the lower half of its recent band. It sits at 13% of the 20-hour range, with support at 4.37 and resistance at 4.61, while the 3-month range of 5.05 to 4.15 shows the stock is closer to the bottom than the top of that window. That does not automatically mean weakness will continue; it means the market is still asking whether this is a base-building phase or just another failed bounce. As shown in the chart, the price is compressed between the moving averages and nearby band levels, which often precedes a sharper move once one side gives way.
Oscillators & Momentum
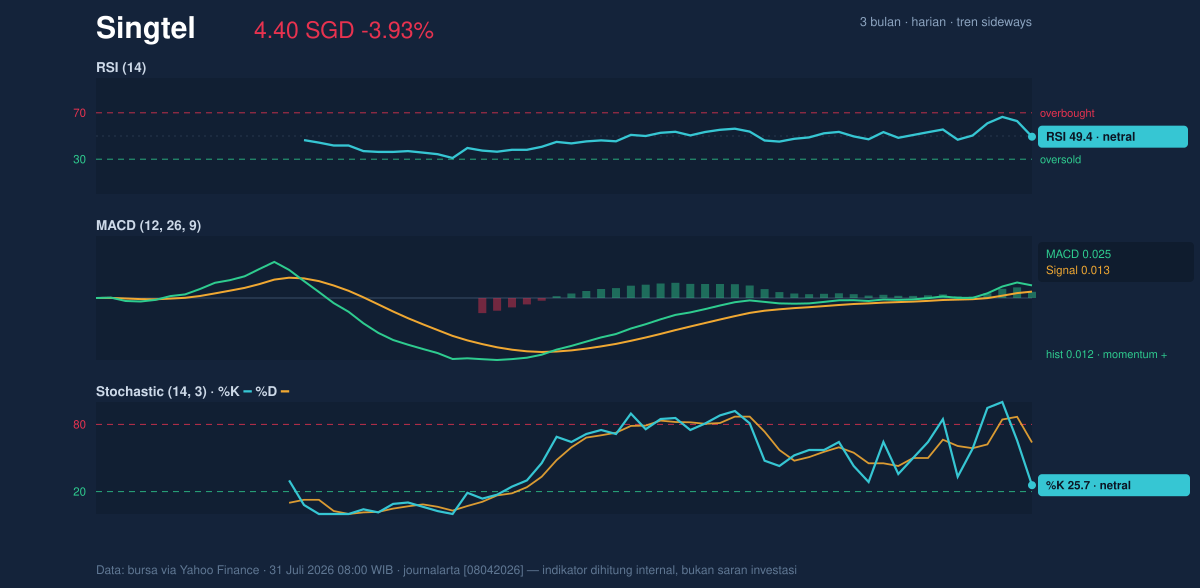
The momentum picture is mixed, but not bearish enough to confirm a breakdown. The RSI at 49.4 is almost dead center, which means the stock is neither overbought nor oversold and is lacking conviction. The Stochastic %K at 25.7 versus %D at 63.8 suggests short-term momentum has cooled sharply, but because the oscillator is still in neutral territory rather than deep oversold, it reads more like hesitation than panic.
The more encouraging part is the MACD setup. The MACD at 0.025 is above the signal line at 0.013, and the histogram at 0.012 remains positive. In plain language, that means underlying momentum is still slightly supportive even though the price has slipped below the short-term average. This kind of divergence can matter: price weakness with positive MACD often reflects consolidation rather than a confirmed trend reversal. As shown in the momentum chart, the oscillators are not aligned strongly enough to call an upswing, but they are also not flashing a clear sell signal.
Volatility & Volume
Bollinger Bands add an important layer. The band structure is tight, with the upper band at 4.56, middle band at 4.44, and lower band at 4.31, while the band width is 5.6%. That narrowing is a classic squeeze signal, meaning volatility has contracted and the market may be storing energy for a larger move. Because the price is below the middle band and the %B is 34%, the stock is trading in the lower part of its volatility envelope, but not yet at an extreme.
ATR reinforces that muted but active setup. The ATR(14) of 0.09, or 2.1% of price, points to moderate day-to-day movement, enough for a directional break to matter without implying disorderly trading. Volume, however, remains only partially convincing. The latest turnover of 29,996,600 is about 0.9x normal against the 20-day average of 31,621,265, so the latest drop was not accompanied by a surge in participation. That matters because heavy volume would suggest conviction; lighter volume implies the slide may be more about positioning than a broad exit. The OBV is rising, which is a constructive clue because it suggests accumulation has not disappeared even while price is under pressure.
Key Levels & Scenarios
The immediate battleground is clear. 4.37 is the nearest support, and a clean hold there would keep the stock inside its current range and preserve the idea of a constructive base. Above price, 4.44 marks the Bollinger middle band and 4.56 is the upper band; together they show where recovery would need to extend before momentum looks healthier. The broader ceiling is 4.61 resistance. If that level is cleared, it would suggest the squeeze is resolving upward rather than downward.
If 4.37 fails, the lower Bollinger band at 4.31 becomes the next obvious pressure point, because a break below the band would mean the market is moving beyond normal compression and into a more defensive phase. For now, the chart is telling a simple story: the stock is not trending strongly, but it is also not confirming a downside collapse.
Technical Verdict: HOLD (wait & see)
- Golden cross and positive MACD histogram support a constructive medium-term bias.
- RSI at 49.4 and Stochastic 25.7 / 63.8 show neutral, uncommitted momentum rather than a clear breakout.
- Bollinger squeeze at 5.6% plus OBV rising suggests a move may be building, but volume is still only 0.9x normal.
- Verdict invalidated if price breaks below 4.37 and then loses 4.31.
- Ideal Entry Range: 4.37 to 4.44
- Exit Target: 4.56 to 4.61
- Stop Loss protection: 4.31
In plain English, the chart says Singtel is sitting at a point where the next break matters more than the latest dip.
Summary Data Singtel
| Last price | 4.40 SGD |
| Change 1 day / 5 days / 1 month | -3.93% / 0.23% / -1.57% |
| Trend / MA-cross | sideways / golden |
| SMA20 / SMA50 | 4.44 / 4.40 |
| RSI (14) / Stochastic %K | 49.4 / 25.7 |
| Bollinger %B / ATR | 34% / 0.09 |
| Support / Resistance 20 days | 4.37 / 4.61 |
| Data as of | 31 Juli 2026 08:00 WIB |


