BP Stock Drops 4.98% Today, Golden Cross Formed
On Agustus 5, 2026: price 525.00 GBp, trend uptrend, RSI 63.0, support 474.55, resistance 555.90. technical analysis of bp stock. BP Stock Drops — full details…

BP plc shares in London are still trading above their short-term trend, but the latest session shows a sharp pullback that tests how much of the recent rally is already priced in. The stock closed at 525.00 GBp, down 4.98% on the day, even though the broader structure remains constructive after a golden cross on the moving averages.
Trend & Price Action
The key point is that BP is not in a broken trend; it is in an uptrend that is being challenged. The shares sit above the SMA20 at 521.63 and also above the SMA50 at 513.41, which matters because price above both averages usually signals that recent buying pressure still outweighs medium-term weakness. The fact that the SMA20 has a positive slope of 3.93% over 5 days reinforces that the short-term trend is still rising rather than flattening out.
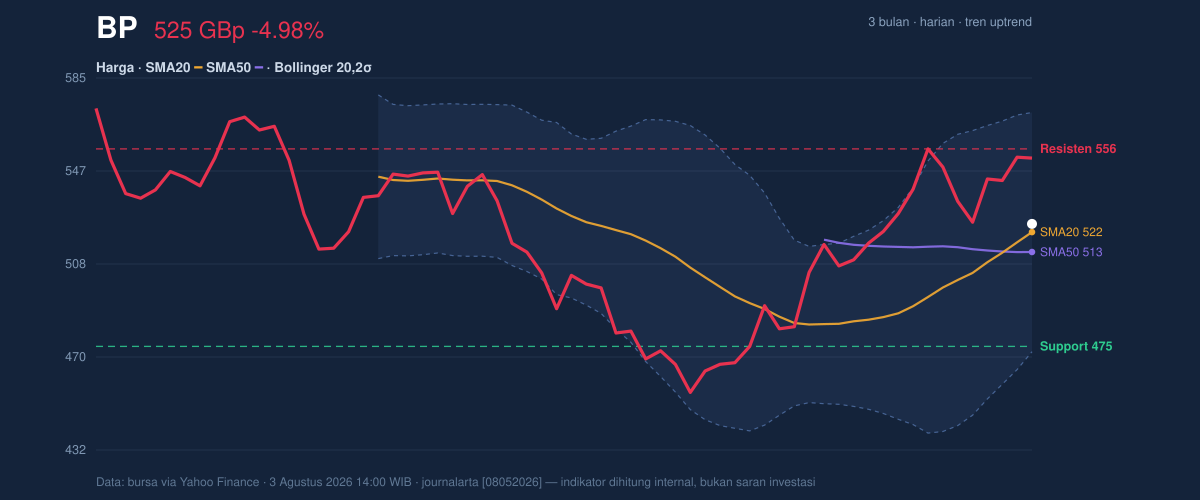
The golden cross — where the SMA20 has moved above the SMA50 — is an important trend signal because it often marks a shift from consolidation to a more durable advance. But the day’s drop shows that momentum is not one-way. BP is trading around the middle of its recent band, with price at about 62% of the 20-hour range, which means it is neither pressing the highs nor collapsing toward the lows. The stock is also still inside the broader 3-month range of 450.60 to 580.60, so the market is working within an established corridor rather than breaking out decisively.
Oscillators & Momentum
Momentum is where the picture becomes more mixed. The RSI at 63.0 is technically neutral, which suggests the stock is not yet in an extreme condition by that measure. But the Stochastic %K at 91.6 and %D at 87.6 are both in overbought territory, which usually means the recent price run has gone far enough that short-term traders may be locking in profits. In plain terms, the stock can still trend higher, but it is more vulnerable to pauses or pullbacks after a strong move.
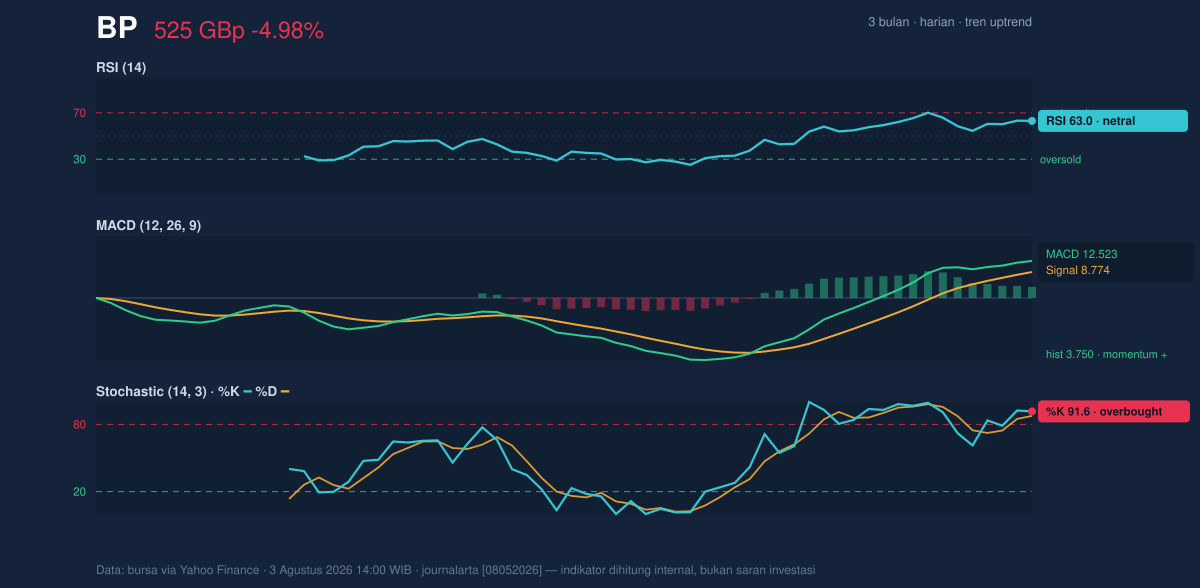
The MACD at 12.523, above its signal line at 8.774, with a histogram of 3.750, still points to positive momentum. That matters because MACD is a trend-following tool: when it stays above the signal line and the histogram is positive, it implies the bullish move has not fully faded. The tension here is that MACD is supportive while Stochastic is stretched. That combination often appears when a trend is intact but near-term upside is becoming harder to sustain without a fresh catalyst.
Volatility & Volume
BP’s Bollinger Bands are not showing an unusually compressed setup. The band width is 18.9%, described as normal, which suggests volatility is present but not in a squeeze that typically precedes a dramatic breakout. The price is also near the middle of the band structure, with the upper band at 570.91 and the lower band at 472.35. That placement tells readers the market is not currently pricing an immediate test of either extreme.
The ATR(14) at 14.36, or 2.7% of price, indicates moderate daily movement. This is important because it means swings can still be meaningful without being disorderly. Volume adds another layer: the latest print of 76,013,966 was about 1.9 times the 20-day average of 40,731,425. Heavy volume on a down day often signals active participation, not just thin trading noise. But the OBV is down, which means the cumulative volume trend has not confirmed the latest price strength. In practical terms, the market has seen buyers and sellers engage more intensely, yet the longer volume trend is not fully backing the rally.
Key Levels & Scenarios
The chart shows the first line of defence at support 474.55. That level matters because it sits above the lower Bollinger band at 472.35, so a break below support would also push price toward the lower edge of the recent volatility envelope. On the upside, resistance at 555.90 is the immediate ceiling to watch, and it sits below the upper Bollinger band at 570.91. A move through resistance would suggest the market is willing to reprice BP back toward the upper part of the band structure.
If BP holds above 521.63 and reclaims momentum, the recent pullback may read as a pause inside an uptrend. If it loses 474.55, the tone changes quickly because that would weaken the short-term structure and put the lower band in play. The current setup is therefore less about a clean breakout and more about whether the stock can absorb profit-taking without giving back the recent advance.
Technical Verdict: HOLD (wait & see)
HOLD (wait & see) is the cleanest read from the current indicators.
- Trend support: price remains above SMA20 521.63 and SMA50 513.41, with a golden cross still in place.
- Momentum is split: MACD is positive, but Stochastic is overbought, which often points to a short-term cooling phase.
- Participation is mixed: volume surged to 1.9× average, but OBV is down, so the latest move is not fully confirmed by cumulative volume.
- Verdict invalidated if price breaks below 474.55, because that would undercut support and bring the lower Bollinger band into focus.
- Ideal Entry Range: 521.63 to 513.41
- Exit Target: 555.90 and then 570.91
- Stop Loss protection: below 474.55
For non-traders: BP still looks technically constructive, but after a sharp daily drop and stretched short-term momentum, the market is waiting for either a rebound above resistance or a deeper pullback toward support.
Summary Data BP
| Last price | 525.00 GBp |
| Change 1 day / 5 days / 1 month | -4.98% / -1.74% / 12.23% |
| Trend / MA-cross | uptrend / golden |
| SMA20 / SMA50 | 521.63 / 513.41 |
| RSI (14) / Stochastic %K | 63.0 / 91.6 |
| Bollinger %B / ATR | 53% / 14.36 |
| Support / Resistance 20 days | 474.55 / 555.90 |
| Data as of | 3 Agustus 2026 14:00 WIB |



