PG Stock Gains 0.36% Today, Testing Key Resistance
On September 18, 2026: price 147.55 USD, trend sideways, RSI 56.3, support 142.64, resistance 147.64. technical analysis of pg stock. PG Stock Gains — full…

At 147.55 USD on 17 September 2026 at 20:30 WIB, Procter & Gamble is trading just below its near-term ceiling, with the stock up 0.36% on the day and 3.20% over five days. The message from the chart is not one of a sharp trend, but of a market that is pressing against resistance while volatility compresses: that combination often matters more than the headline gain itself, because it shows where momentum may either extend or stall.
Trend & Price Action
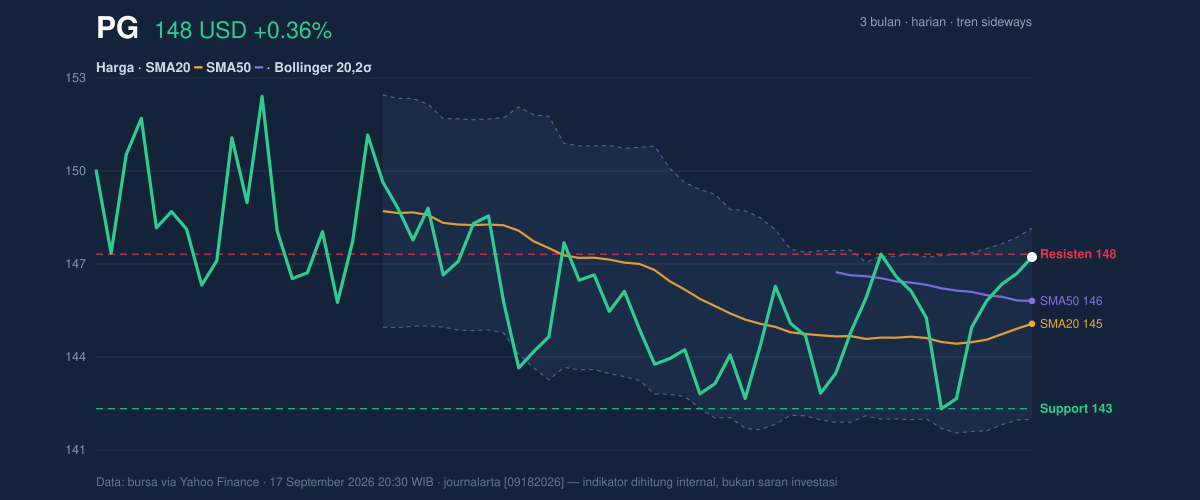
As shown in the chart, PG sits above SMA20 at 145.39 and above SMA50 at 146.13, which tells traders the stock has reclaimed its short- and medium-term averages. That is a constructive setup, but the broader pattern is still sideways, and the 0.44%/5-day slope in SMA20 suggests the trend is improving rather than accelerating. In plain terms: the stock has enough support to avoid looking weak, but not enough trend strength yet to look decisively bullish.
The positioning is also tight. PG is trading at 98% of its 20-hour range, with support at 142.64 and resistance at 147.64. That means the market is already near the upper boundary of the recent range, where sellers have recently shown up. The 3-month range adds context: the stock is closer to the 154.32 high than the 140.20 low, but still below the peak, which fits a stock that has recovered, not broken out.
Oscillators & Momentum
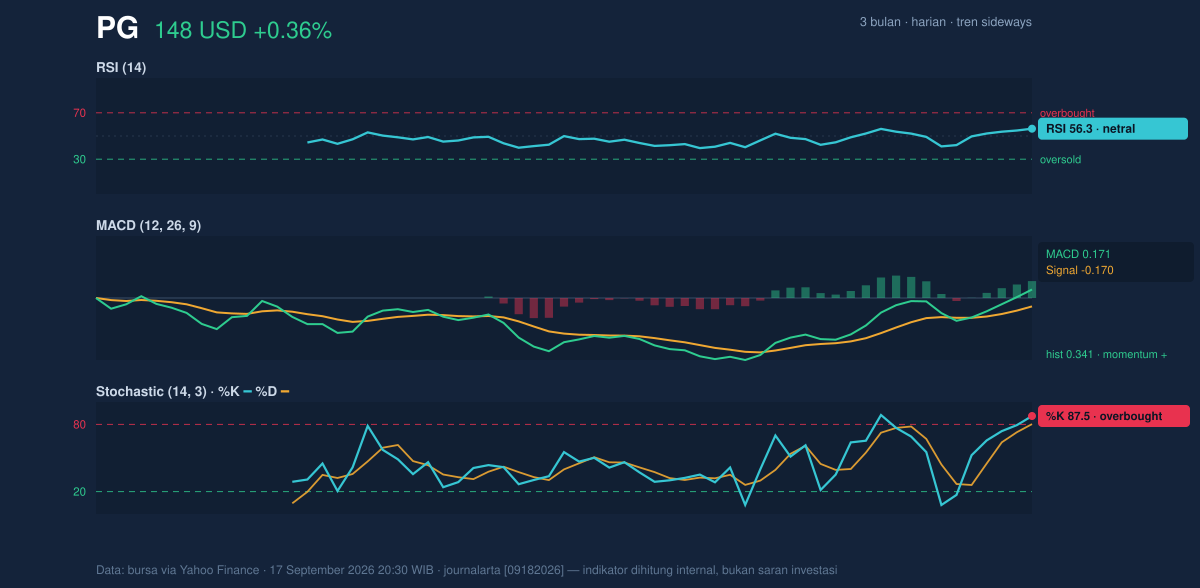
The momentum picture is mixed, and that mix is important. RSI at 56.3 is still neutral, which means the stock is not stretched on the broad momentum gauge. But the Stochastic %K at 87.5 and %D at 80.3 are in overbought territory, a signal that the latest push higher may be getting extended in the short term. Overbought does not mean a reversal is guaranteed; it means the stock is closer to a pause point than a fresh entry point based on momentum alone.
That tension is resolved somewhat by the MACD at 0.171, with the signal line at -0.170 and a histogram of 0.341. For general readers, MACD is a trend-following gauge: when the faster line pulls above the slower signal line, it suggests upward momentum is building. Here, the positive histogram says that momentum is still tilting higher, even if shorter-term oscillators are already hot. In other words, the trend engine is still running, but the fuel gauge is not full.
Volatility & Volume
The Bollinger Band structure adds another layer to the story. PG is trading near the upper band, with %B at 85%, and the band width is only 4.3%, described in the data as a squeeze. A squeeze means the bands have narrowed, which often precedes a larger move; the direction, however, is not guaranteed. Because price is already close to the upper band at 148.48, the immediate test is whether buyers can force a clean move beyond resistance, or whether the stock simply oscillates inside the compressed range.
Volume does not yet confirm a breakout. Last volume was 6,737,800, below the 20-day average of 8,733,525, or about 0.8× normal. That matters because a move toward resistance on lighter participation can be more fragile than one backed by broad trading interest. Still, OBV is rising, which is a subtle but useful sign: on-balance volume tracks whether money is flowing in over time, and a rising line suggests accumulation is improving even if the latest session was not especially heavy. ATR at 2.29, or 1.6% of price, points to moderate volatility — enough for a meaningful move, but not the kind of disorder that usually accompanies panic or euphoria.
Key Levels & Scenarios
The near-term technical map is fairly clear. Resistance at 147.64 is the first level to watch because price is already sitting just below it. A decisive push through that area would put the 148.48 Bollinger upper band in play, and would suggest that the squeeze is releasing upward. On the downside, support at 142.64 sits above the 142.29 Bollinger lower band and below both moving averages, so a break there would weaken the current recovery and imply the market is slipping back toward the lower half of the recent range.
The practical signal is straightforward: above resistance, the chart shifts from range-bound to breakout-prone; below support, the recent bounce loses credibility. For now, PG is still negotiating the top of its band rather than escaping it.
Technical Verdict: HOLD (wait & see)
HOLD (wait & see) because the chart is constructive but not fully confirmed.
- Price is above SMA20 and SMA50, which supports the short-term trend.
- MACD is positive, showing momentum is still constructive.
- Stochastic is overbought and price is already near resistance at 147.64, so upside is not yet cleanly confirmed.
- Verdict invalidated if price breaks below 142.64, which would damage the current range structure.
Ideal Entry Range: 145.39 to 146.13, near the moving-average zone where the stock has shown support.
Exit Target: 148.48, the upper Bollinger band, with 147.64 as the first checkpoint.
Stop Loss protection: 142.64, just below the stated support and near the lower Bollinger band at 142.29.
For non-traders, this means PG looks steady, but the chart is waiting for proof that the recent climb can continue.
Latest fact: volume was 6,737,800, below the 8,733,525 20-day average.
Summary Data PG
| Last price | 147.55 USD |
| Change 1 day / 5 days / 1 month | 0.36% / 3.20% / 2.20% |
| Trend / MA-cross | sideways / none |
| SMA20 / SMA50 | 145.39 / 146.13 |
| RSI (14) / Stochastic %K | 56.3 / 87.5 |
| Bollinger %B / ATR | 85% / 2.29 |
| Support / Resistance 20 days | 142.64 / 147.64 |
| Data as of | 17 September 2026 20:30 WIB |



